The Reliability Agent, in action: 30,000 GPUs and a temperature it wasn't told about
The best way to show what an agent can do is to give it a genuinely hard problem and get out of the way.
So we did. We pointed Reliafy's Reliability Agent at the TitanGPULife dataset — the complete failure records of every GPU in Oak Ridge's Titan supercomputer, published alongside the SC20 paper by Ostrouchov et al. — and gave it one instruction: read the repository, understand the data, and build the best model you can for GPU failure. Think about failure modes, covariates, and which survival model actually fits.
That's it. No column guide, no hint about what to look for, no suggested model. 30,207 GPUs, about 100,889 GPU-years of running time, and 83% of the records censored — most GPUs never failed, they were simply still running when the machine was switched off. This is not a toy. Heavy censoring is where naive analyses quietly go wrong.
Here is what it did.
First, it read the manual
Before touching a number, the agent fetched the repository and read the original authors' R analysis code to learn how the variables were defined. That mattered: in this data a GPU counts as a failure only if it was removed and had recorded a double-bit ECC memory error (DBE) or fell "off the bus" (OTB). Everything else — including GPUs pulled for unrelated reasons — is right-censored. Get that event definition wrong and every downstream number is wrong. The agent got it from the source, not from a guess.
It also learned that the time axis is accumulated operational lifetime per
GPU, not calendar time, and that the position columns (cage, node, slot,
row) encode where in the cabinet each GPU physically lived. Hold that thought.
Then it found the thing that changes everything
The agent's first real finding, three steps in, was a fork in the road:
The original (
old) GPUs fail at 26.7%; the reworked (new) GPUs fail at 0.55% (only 62 of 11,370). Annualized, the reworked parts fail ~27× less often. These are different hardware revisions and must be modelled separately — pooling them is meaningless.
Titan's GPUs came in two batches: the original 2013 install and a post-2016 rework. The rework didn't tweak the failure rate — it collapsed it by a factor of 27. Any model that averaged the two together would describe a machine that never existed. The agent split them and, sensibly, noted that the new batch had too few failures over too short a window to support a wear-out model at all — so it characterised that batch honestly as a very low, near-constant hazard and moved its real attention to the old one, where 5,027 of the 5,089 failures live.
It worked out how the GPUs were dying
Two questions decide the shape of a life model: is failure random, or does it accumulate with age — and is there one failure mechanism or several?
On the first, the agent fit and ranked a dozen parametric families. The exponential distribution — constant hazard, the "failure is random" assumption — was decisively rejected (AIC 37,328 against ~32,000 for the wear-out models). The old batch shows near-flat survival for the first two years, then a steady decline: classic wear-out, a Weibull shape parameter well above 1. The GPUs weren't dying at random. They were wearing out.
On the second, it split the failures by cause and found two genuinely different clocks:
DBE (double-bit ECC, 3,819 events) is the dominant wear-out mode, median ~7.5 years. OTB (off-the-bus, 1,475 events) fails later, median ~14.5 years. Different signatures → a competing-risks decomposition is justified.
Memory errors and bus failures are not the same failure. One is a cumulative degradation of the board; the other strikes later and rarer. Treating them as a single "failure" would blur two mechanisms into one meaningless average — a mistake the agent explicitly avoided.
The winning model: only 41% were ever going to fail
Here's the part that separates a competent analysis from a rote one.
Even after splitting by batch, a plain Weibull couldn't fit the heavy censored tail of the old batch — the survival curve flattens into a plateau that a standard distribution insists on bending to zero. The agent recognised the signature of a limited-failure-population (or "cure") model: a susceptible subpopulation that carries the defect and will eventually fail, and a robust remainder that simply won't.
It fit one. The number that matters is p = 0.407. Only about 41% of the old GPUs were ever destined to fail — the rest were robust and would have run indefinitely. That single parameter reframes the whole reliability picture: this isn't a population wearing out uniformly, it's a defective subpopulation working its way through, against a healthy majority. The cure model (AIC 32,221) beat the best plain distribution (32,901) and matched the empirical survival curve to within a point or two everywhere.
And then it found a cause it was never told about
The agent still had those position columns. It checked whether where a GPU sat
predicted whether it failed — and the answer was stark. Failure rate climbed
monotonically with cage, the vertical position in the cabinet:
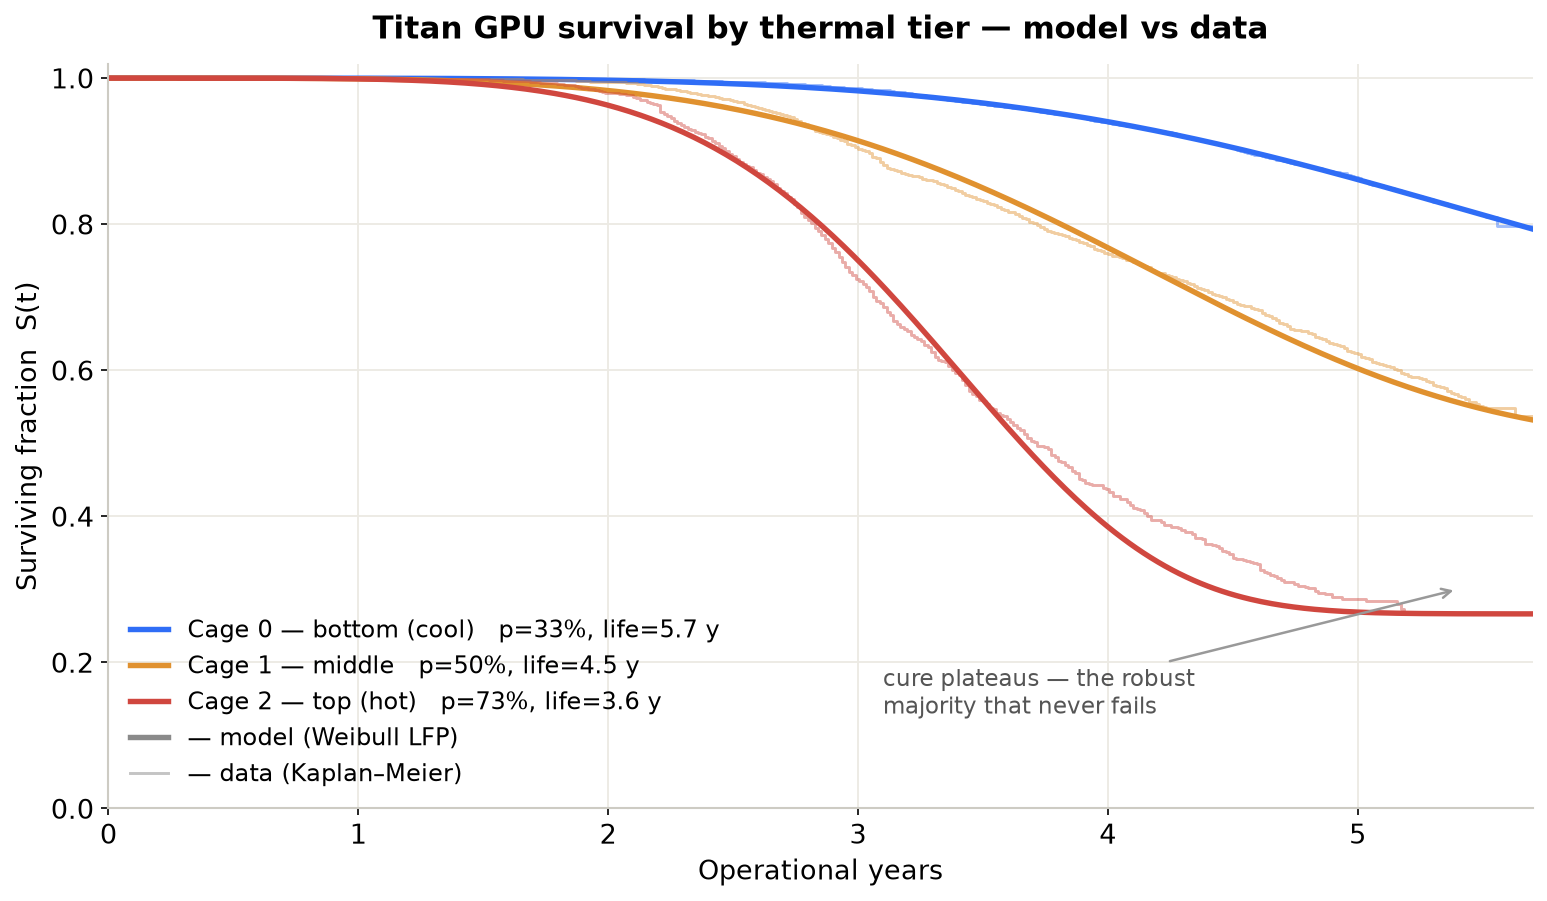
Characteristic life collapses 8.2 → 6.3 → 4.2 years from bottom cage to top; nonparametric survival at 5 years goes 86% → 62% → 29%. Warm air rises; the hot cage fails roughly twice as often.
It's a thermal gradient, discovered from failure statistics alone. Warm air rises through the cabinet, the top GPUs run hotter, and heat drives failure. Nobody labelled a "temperature" column — the agent inferred it from physical position and the shape of the survival curves.
Then it did something subtle and correct. It noted that temperature doesn't just speed failures up — it changes how many GPUs are susceptible in the first place. Fitting the cure model per cage gives three clean, well-separated curves — and the parametric model (thick lines) sits almost exactly on the non-parametric Kaplan–Meier estimate from the raw data (thin lines) at every tier. That agreement is the proof the modelling worked:
| cage (thermal tier) | susceptible fraction p | characteristic life |
|---|---|---|
| bottom (cool) | 33% | 5.7 years |
| middle | 50% | 4.5 years |
| top (hot) | 73% | 3.6 years |
Temperature drives both the incidence (the fraction carrying the defect, 33% → 73%) and the speed (5.7 → 3.6 years). And because the effect changes the population rather than uniformly scaling the hazard, the agent flagged that a standard proportional-hazards regression would be wrong here — the proportional-hazards assumption is violated, so cage should be stratified, not multiplied in. That is a genuinely expert call, and it made it unprompted.
From a model to a decision
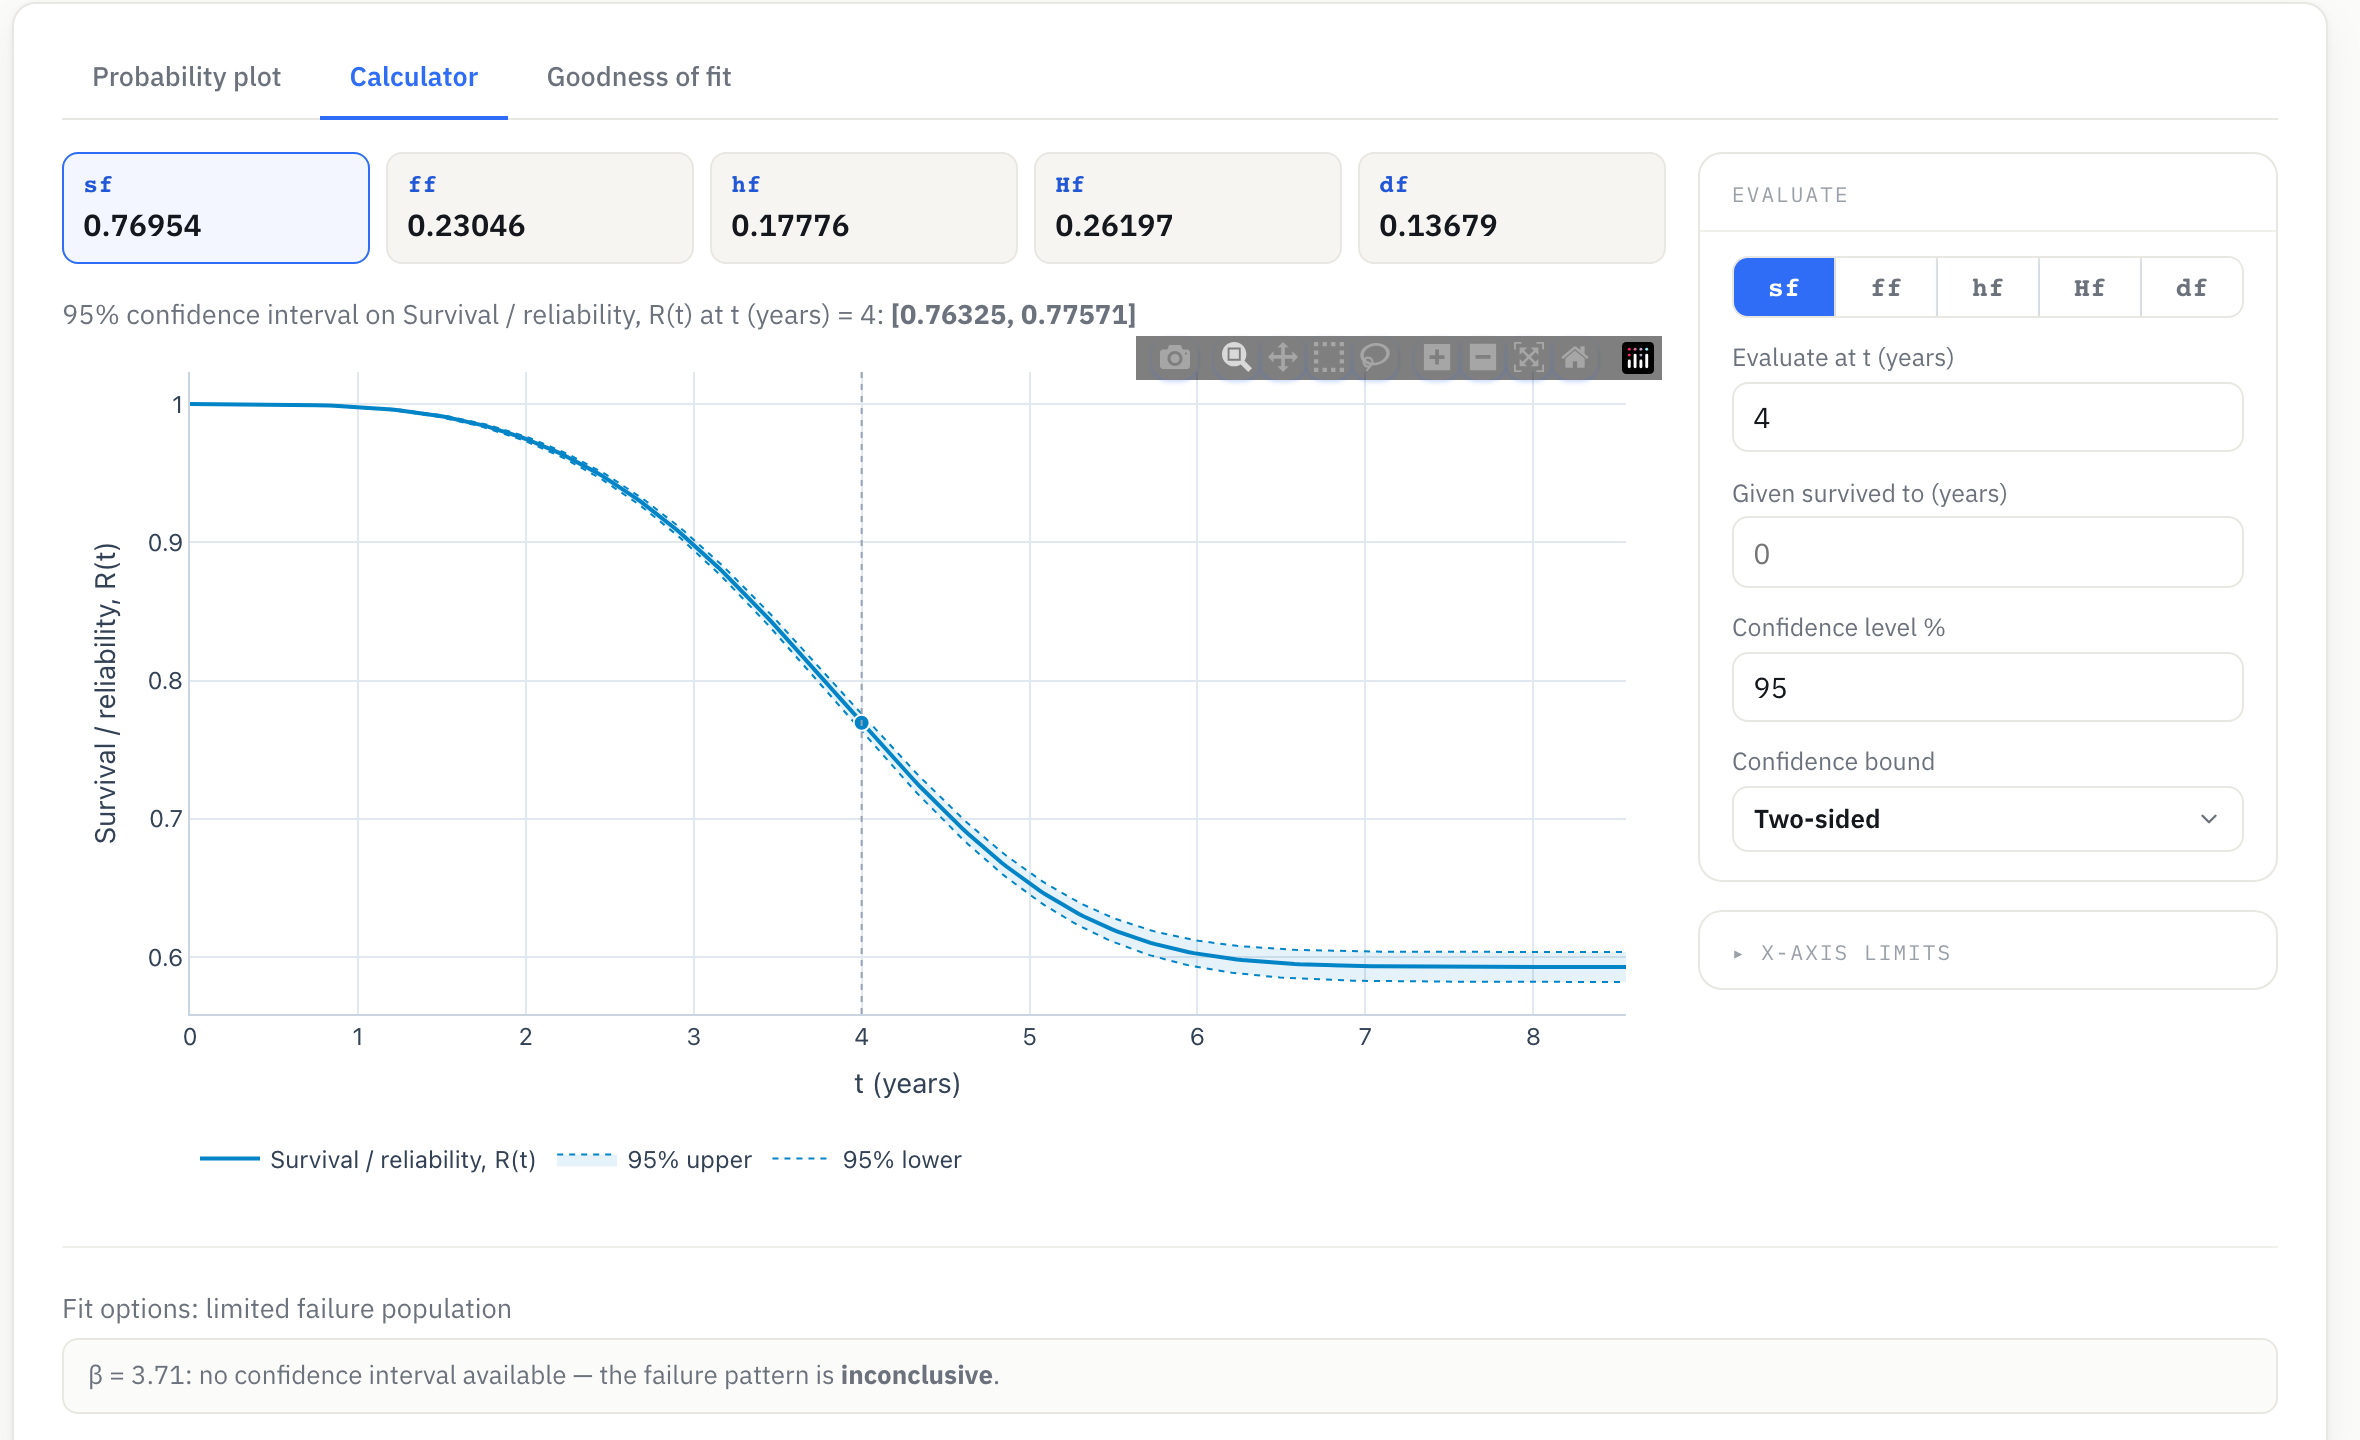
A fitted curve isn't the deliverable — a decision is. Once the agent's model is in Reliafy, it stops being a chart and becomes a calculator. Ask it the reliability of an old-batch GPU at four years and it reads straight off the curve: R(4 years) = 0.770, with a 95% confidence interval, and the whole survival function plotted so you can see the cure plateau it settles onto.
The question a maintenance planner actually asks, though, isn't about one part — it's about the fleet. Point the model at a set of in-service GPUs, each with its own accumulated running time, and Reliafy turns the curve into a forecast: how many of these should we expect to fail next month? For a fleet of 150 old-batch GPUs already around three years old, the answer is ≈ 1.5 failures in the next month (and about 21 over the coming year), with a spread — the sort of number that sizes a spares order or a maintenance window.
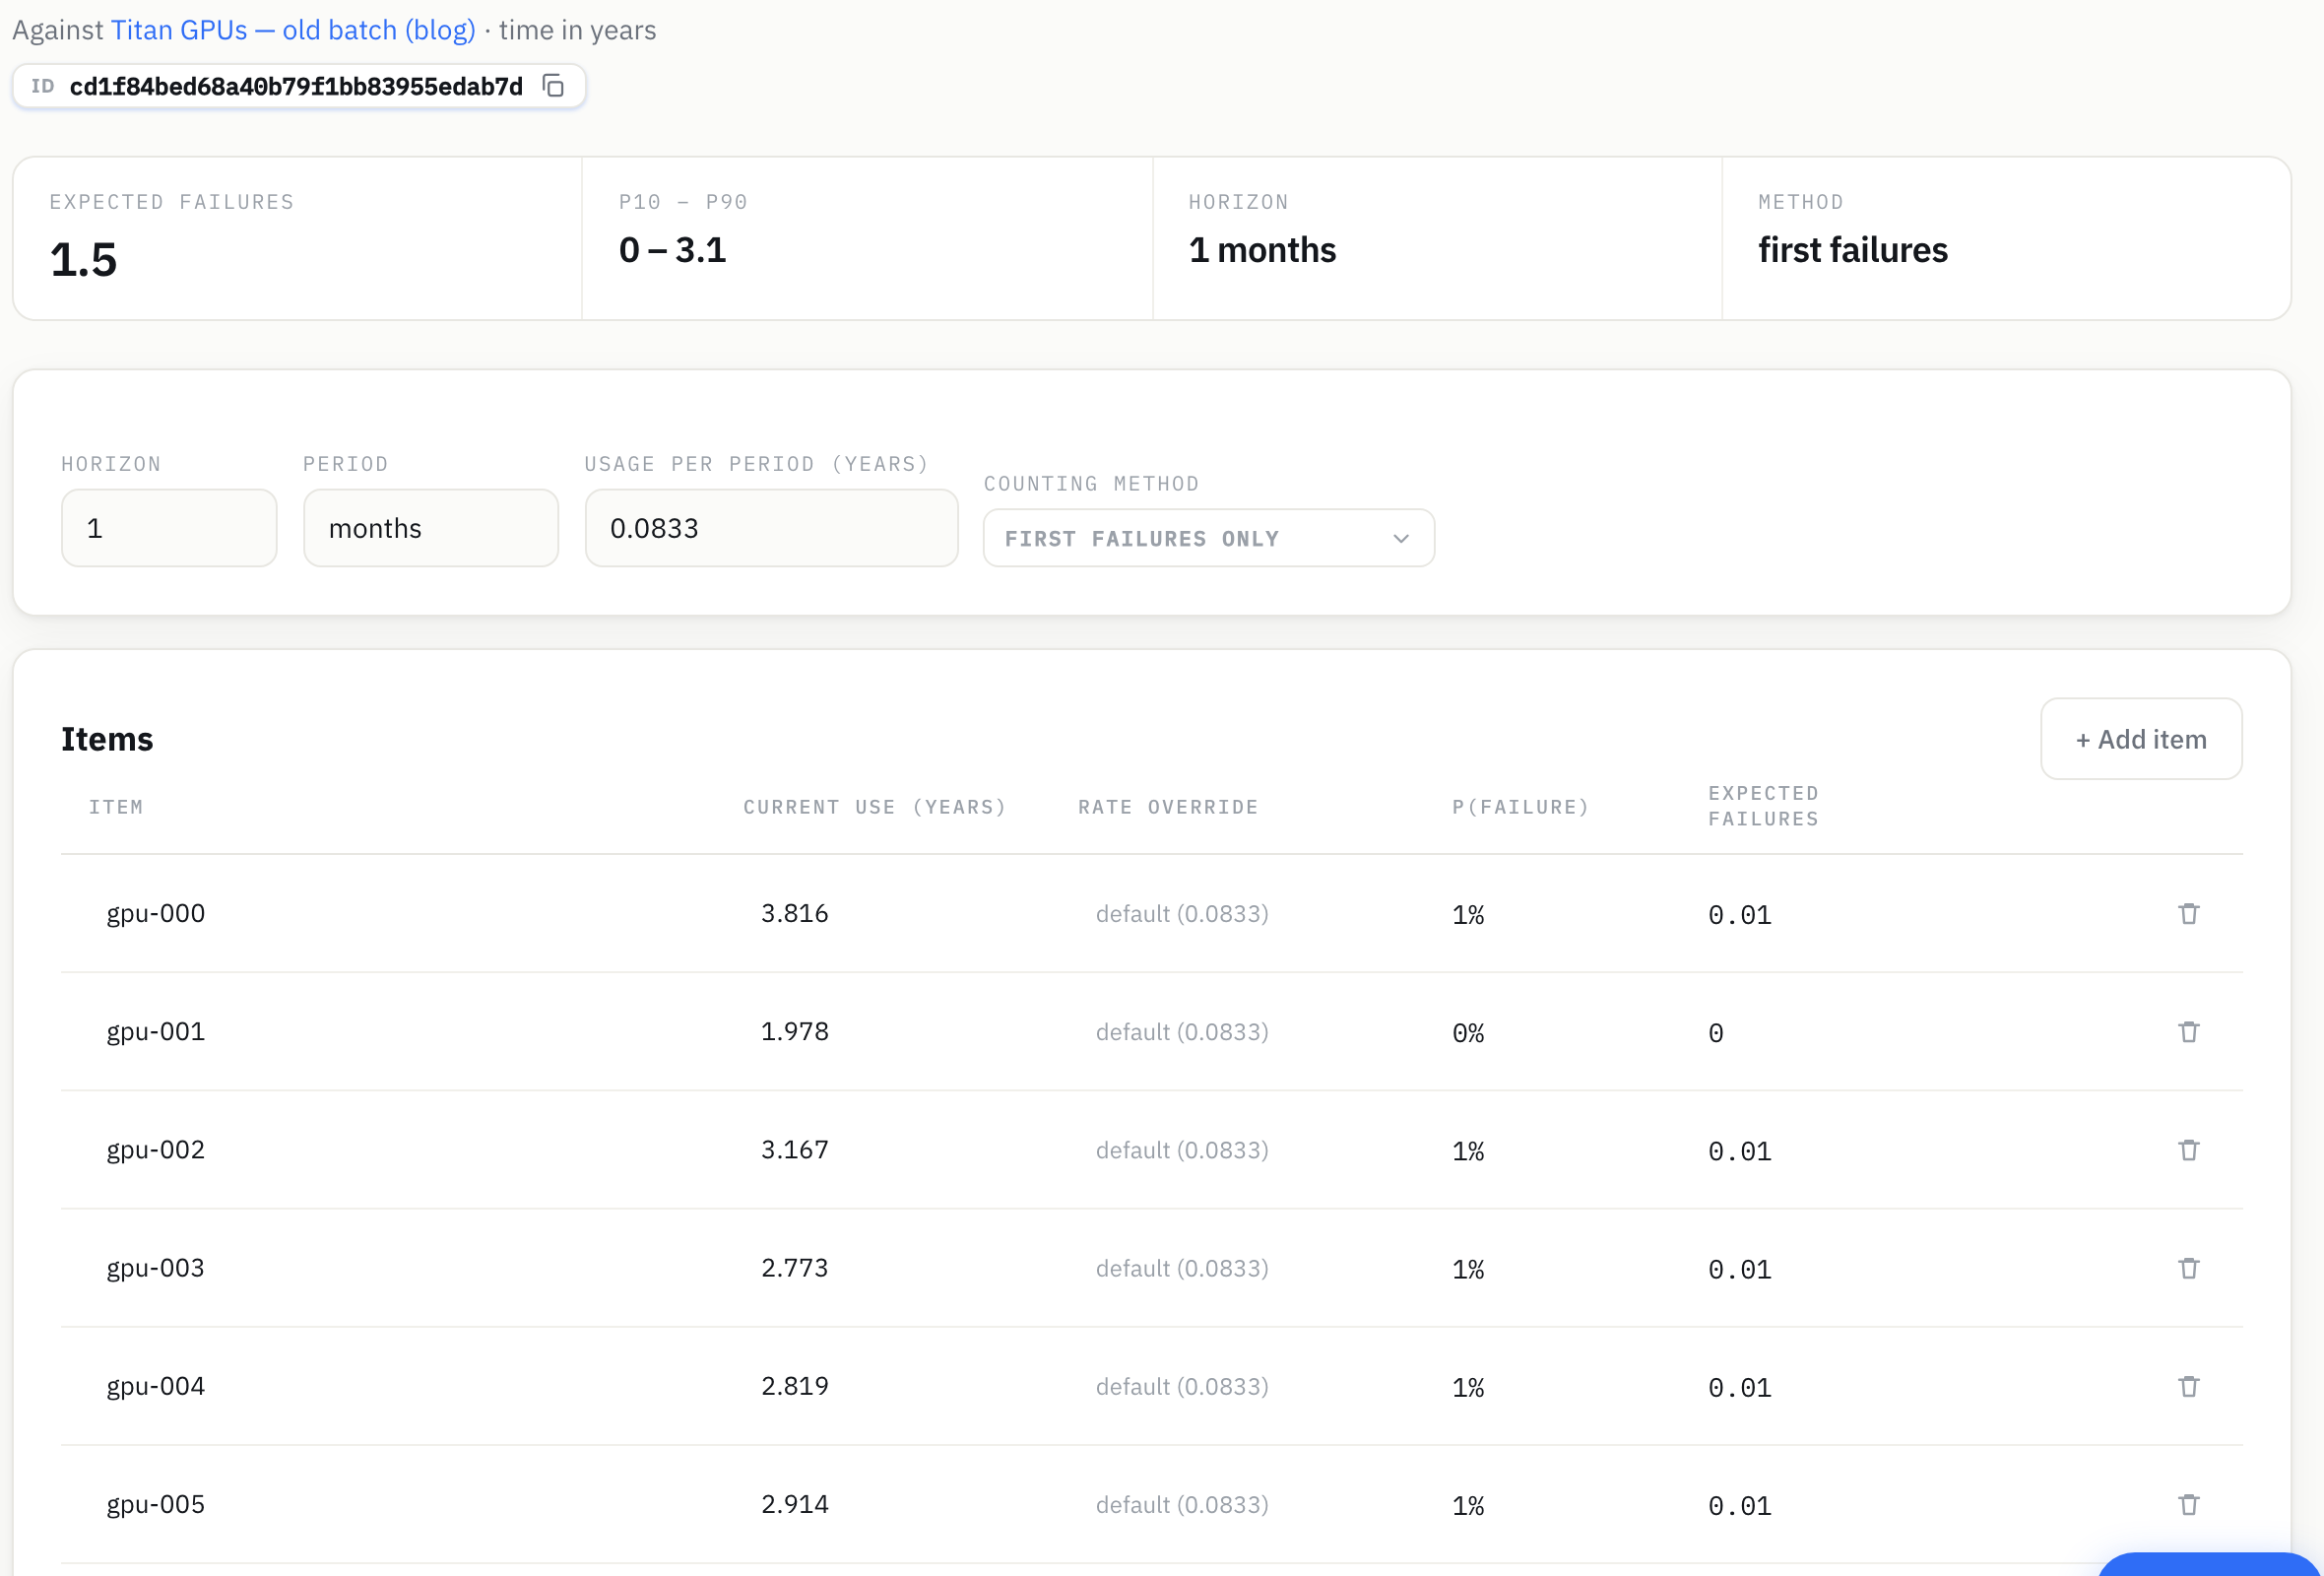
That's the whole arc in one tool: a hard dataset in, a defensible model the agent chose, and out the other end the two numbers an operator can act on — the reliability of a part at any age, and the failures to plan for across a fleet.
Why this is the point
Read back what the agent chose, on its own, from a bare instruction and a CSV: split by hardware revision; reject the exponential; decompose competing failure modes; recognise a cure fraction; infer a thermal covariate from physical position; and refuse a proportional-hazards model because the physics didn't support it. That is not a chatbot summarising a spreadsheet. It's the reasoning of a reliability engineer who has done this before.
And every number it produced is real. The agent doesn't invent statistics — it writes and runs analysis code against the same open-source engines Reliafy uses, SurPyval for the survival fitting. We proved that the honest way: we took its winning model, refit it inside Reliafy from the same data, and got α = 4.199, β = 3.711, p = 0.407 — identical to the last decimal. The screenshots above are that reproduction, not a mock-up.
The agent even closed by offering the next moves a good analyst would: a unified accelerated-failure-time model with a cage×node interaction, a proper cause-specific competing-risks analysis, or a cure model where the susceptible fraction is a smooth function of position rather than stratified. It knew what it hadn't done yet.
This is what we mean by a Reliability Agent. Not autocomplete for engineers — an analyst you can hand a hard, messy, real dataset and get back a defensible model, the reasoning behind it, and objects you can open and check yourself.
Try it on your own data
The Reliability Agent is part of the Pro plan (and runs on your own API key if you self-host). Hand it a CSV of failure records — or just describe a system — and watch it propose a plan before it does anything. The assistant is free from your first session.
Reliafy is open source. The hard part of reliability engineering was never the arithmetic — it was knowing which model the data was asking for. That part now comes with the tool.