Handle censored data (units that haven't failed)
Before you start: A dataset where not every unit has failed, or where failure times aren't exactly known.
This is the single most common thing people get wrong with life data, and it's worth getting right before anything else, because it doesn't produce an error — it produces a plausible-looking model that's simply pessimistic.
Here's the situation. You pull records for 30 pumps. Eighteen have failed, at known times. Twelve are still running. What do you do with the twelve?
The two instinctive answers are both wrong. Deleting them throws away real evidence — you know those units survived a long time, which is information about reliability, and dropping it biases you toward the units that failed early. Treating their current age as a failure time is worse: you're recording failures that didn't happen, which makes your equipment look far less reliable than it is.
The right answer is to tell the model that those units survived at least that long. That's censoring, and it's handled properly in the likelihood — the survivors contribute exactly the information they actually carry.
Right censoring: still running
This is the ordinary case above. Add a column flagging which rows are failures
and which are survivors — conventionally 0 for a failure, 1 for
right-censored:
hours,censored
312,0
420,0
506,0
2000,1
2000,1
When you fit, choose that column as Failed or still running? in the Data
step. Reliafy lists each value it finds with its number of rows, and you mark
each one Failed or Still running — so a file that uses 1 for a failure,
or words like failed and running, works as it is. That's the whole change,
and it will often move your fitted life substantially.
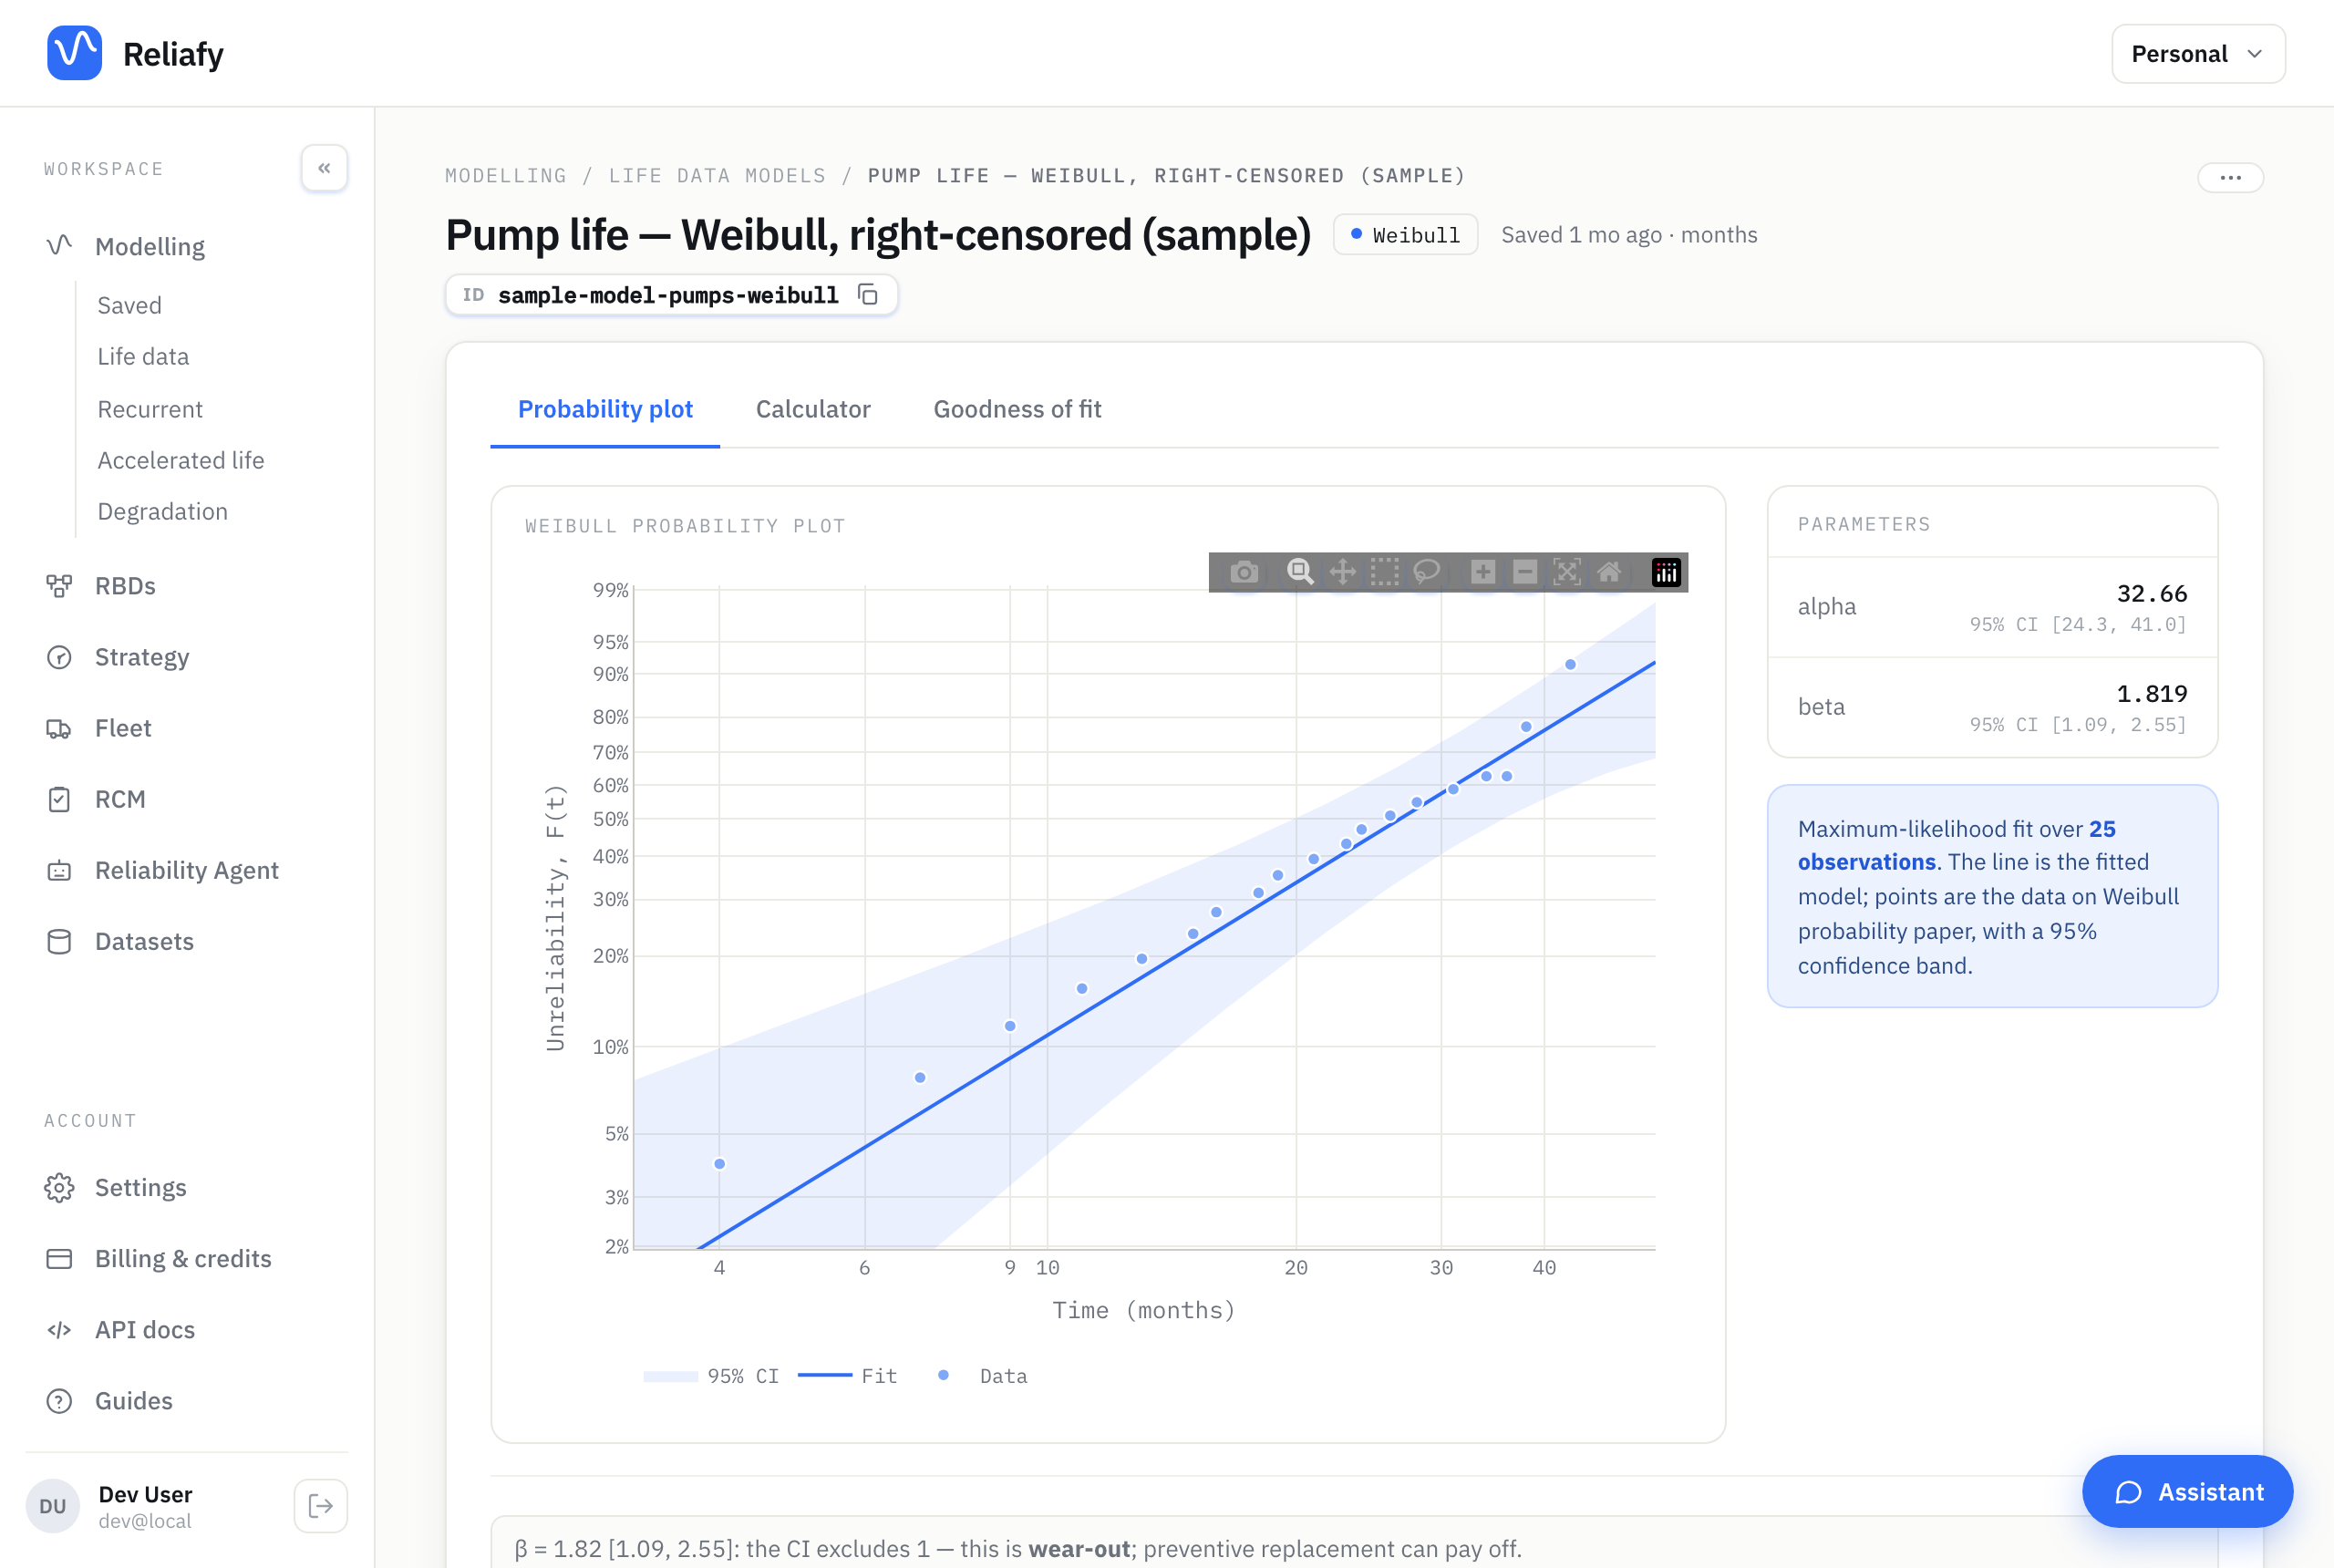
The sample pump model is exactly this case: 25 pumps, 18 failed and 7 still running. Its Weibull fit puts the characteristic life at 32.7 months, with the survivors counted properly.
Right censoring covers more cases than people realise: units still in service, units removed for an unrelated reason, units that survived to the end of a test, and units whose records simply stop.
Interval censoring: failed somewhere between inspections
Often you don't observe failures as they happen — you inspect monthly and find something already broken. You know it failed between the last two inspections, but not when.
Recording the inspection date as the failure time systematically overstates life. Instead, give both bounds. Open Advanced: interval and truncated data in the Data step and choose the columns for the Earliest possible failure time and the Latest possible failure time; they're used instead of a single time:
xl,xr
30,60
60,90
The unit failed somewhere in that window, and the model accounts for the uncertainty rather than pretending the failure happened at the moment you looked.
Left censoring: already failed when first observed
If a unit had already failed by the time you first checked, you know only that
its life was less than that time. Flag it with -1 in the censoring column:
the Data step shows it as Found failed (left-censored).
Truncation: a different thing entirely
Truncation is often confused with censoring, but it's a distinct problem. Censoring means a unit is in your dataset with an imprecisely known life. Truncation means units are missing from your dataset altogether because of how it was collected.
The classic case: you only have warranty records, so units that failed after the warranty expired never appear. Or you started recording in 2020, so anything that failed before then is absent. Your sample isn't representative, and a model that doesn't know this will be biased.
Under the same Advanced section, choose the columns for Observed from (left truncation) and Observed until (right truncation) and the fit corrects for the observation window.
Counts
If one row stands for several identical units — "5 pumps, all failed at 1,000 hours" — choose that column as the Count rather than duplicating rows. Combining the censoring column and a count is the compact way to express a big fleet: one row for the failures at each time, one row for the survivors.
How to tell it's working
The Data step sums it up under the columns (18 failures, 7 still running for the pump sample), so you can see at once whether the codes are the right way round: a fit where nearly every row is "still running" almost always means they aren't.
Fit the same data with and without the censoring column chosen and compare. The censored fit will show a longer characteristic life — often dramatically so — and that difference is the reliability your equipment actually has and was previously being denied.
If your fitted life looks lower than operational experience suggests, unmapped censoring is the first thing to check.
Where to go next
The mathematics — how each censoring type enters the likelihood, and worked examples — is in the Learn article on censored data and suspensions.