Verify a safety function's PFDavg and SIL
A safety instrumented function (SIF) is a loop that takes a process to a safe state when something goes wrong: sensors that see the hazard, a logic solver that decides, and a final element, usually a valve, that acts. Most of the time it does nothing. Its dangerous failures stay hidden until a proof test finds them, or until the day it's needed.
For a low-demand function, IEC 61511 (the process-industry standard, built on IEC 61508) asks you to show that its average probability of failure on demand, the PFDavg, falls inside the band of the safety integrity level (SIL) the hazard needs: below 0.1 for SIL 1, 0.01 for SIL 2, 0.001 for SIL 3. The PFDavg comes from each element's dangerous undetected failure rate (λDU), how often it's proof-tested, how the redundant channels vote, and how often they fail together.
Here is that calculation on a typical loop, and five changes engineers argue about.
The starter
On the RBDs page, choose Verify a safety function (SIL / PFDavg) → Open the starter. It opens an unsaved diagram:
- two pressure transmitters, λDU 3e-7 per hour each, voting 1oo2 (either one can trip), in a common-cause group with β = 5%;
- a logic solver, λDU 1e-8 per hour;
- a shutdown valve, λDU 1e-6 per hour;
- every element proof-tested every 8,760 hours (yearly) and repaired at once when a test finds it failed;
- a target of SIL 2.
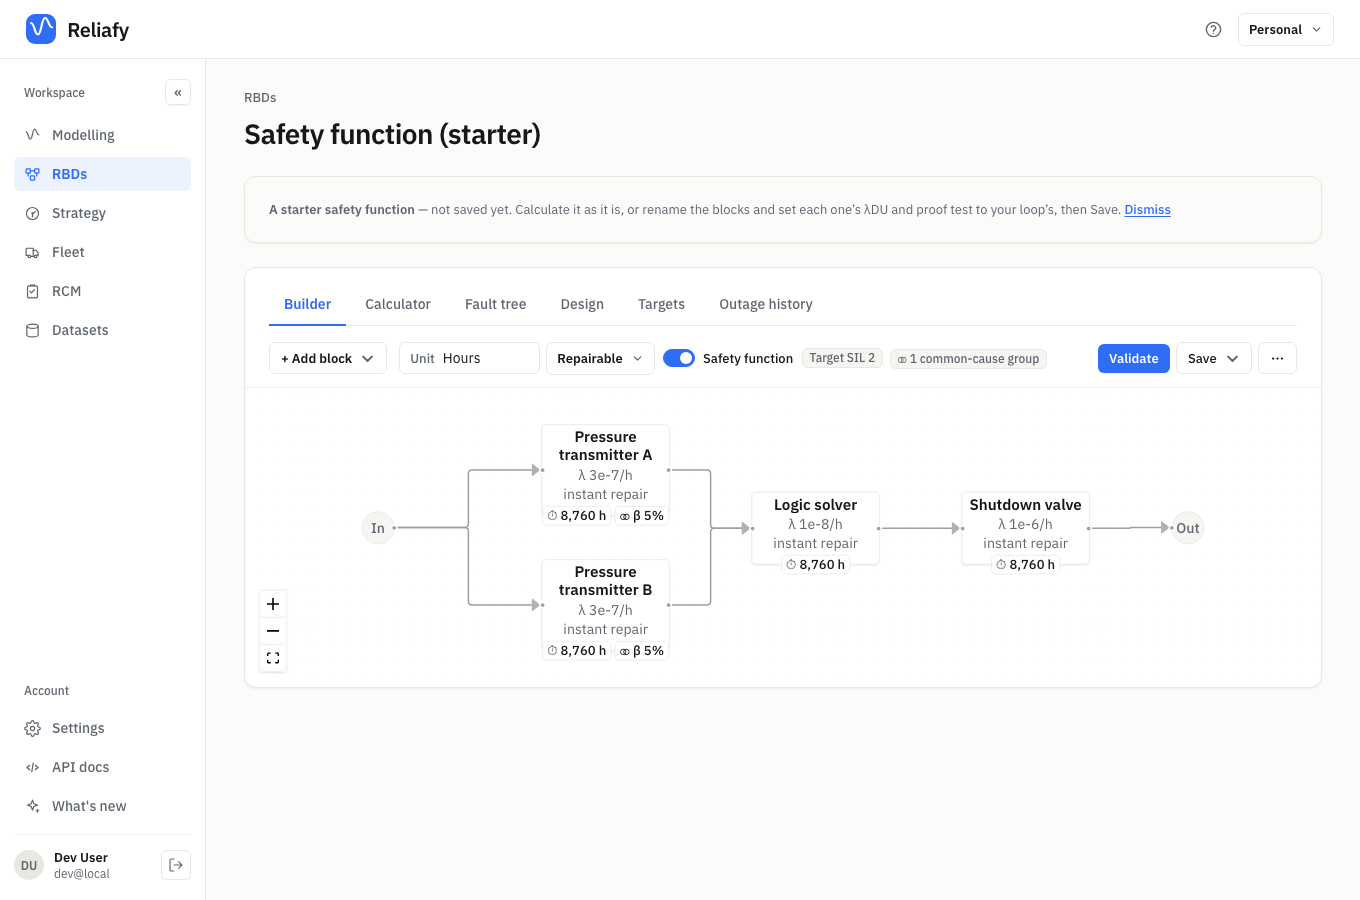
These are typical orders of magnitude, there to be replaced with your loop's own figures.
The answer: 0.00448, SIL 2
Open the Calculator and click Calculate. The result:
- PFDavg 0.00448, which is SIL 2: target met;
- 45% of the SIL 2 limit of 0.01;
- a risk reduction factor of 223 (1 / PFDavg).
Reliafy works this out exactly: the long-run unavailability of the diagram, averaged over the proof-test cycle, with the common-cause group's members' joint states solved as a Markov chain. It doesn't use the simplified textbook formulas, but they make a good check. The valve on its own contributes about λT/2 = 1e-6 × 8,760 / 2 = 0.00438. The logic solver adds 0.00004, the transmitters' common cause (βλT/2) 0.00007, and the transmitters failing independently about 0.000002. That sums to roughly 0.00449.
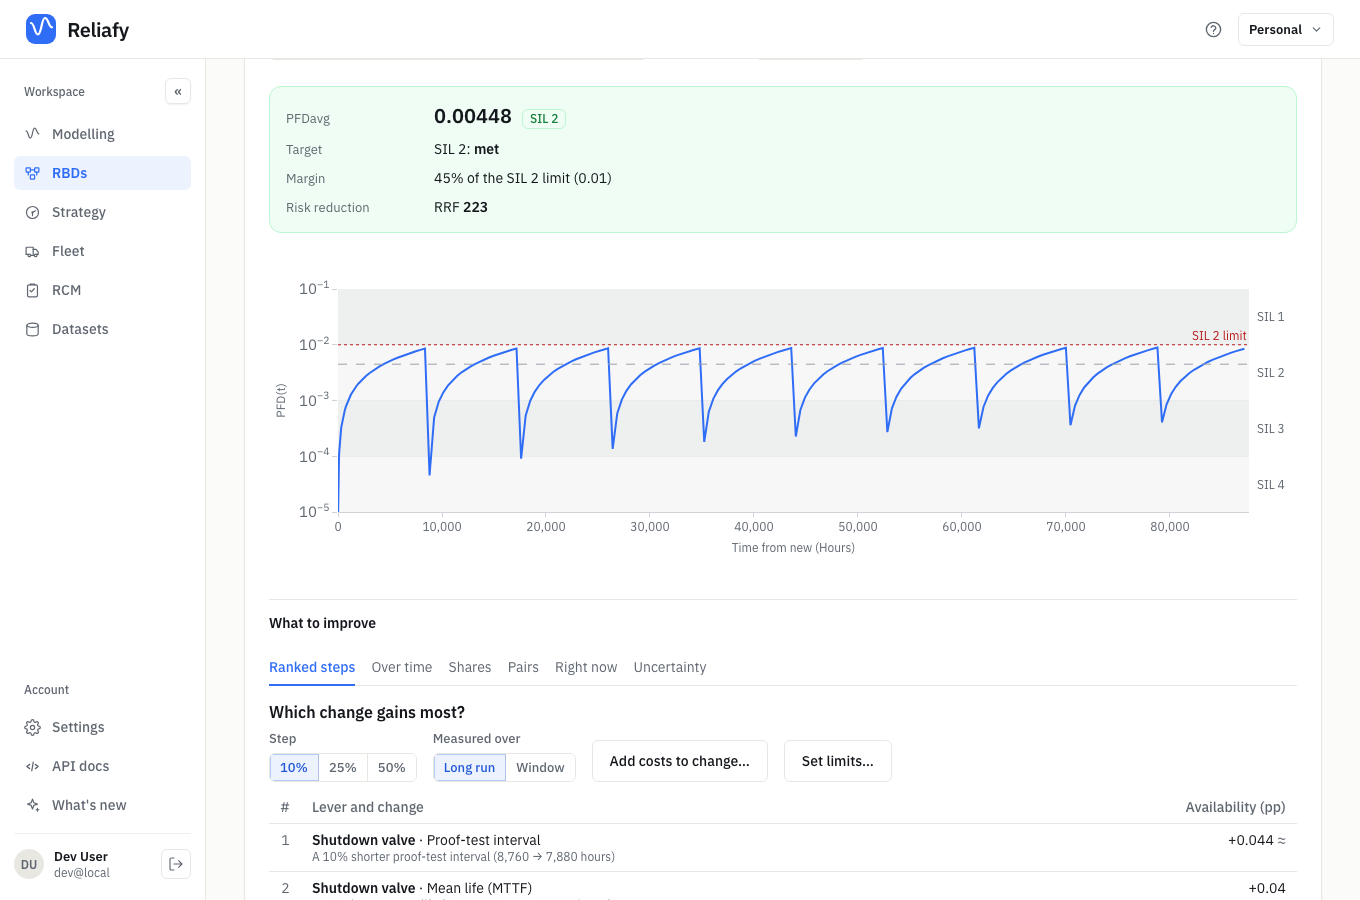
The chart under the result is PFD(t), on a log scale over the SIL bands. It climbs through each year as hidden failures build up and drops at every proof test. The PFDavg, dashed, is its average. The peaks sit just under the dotted SIL 2 limit: in the weeks before each test, this loop is close to being a SIL 1 function. A SIL is a claim about the average, and the sawtooth is a reminder of that.
Where the PFDavg comes from
Under Details, Where the PFDavg comes from splits the figure by element.
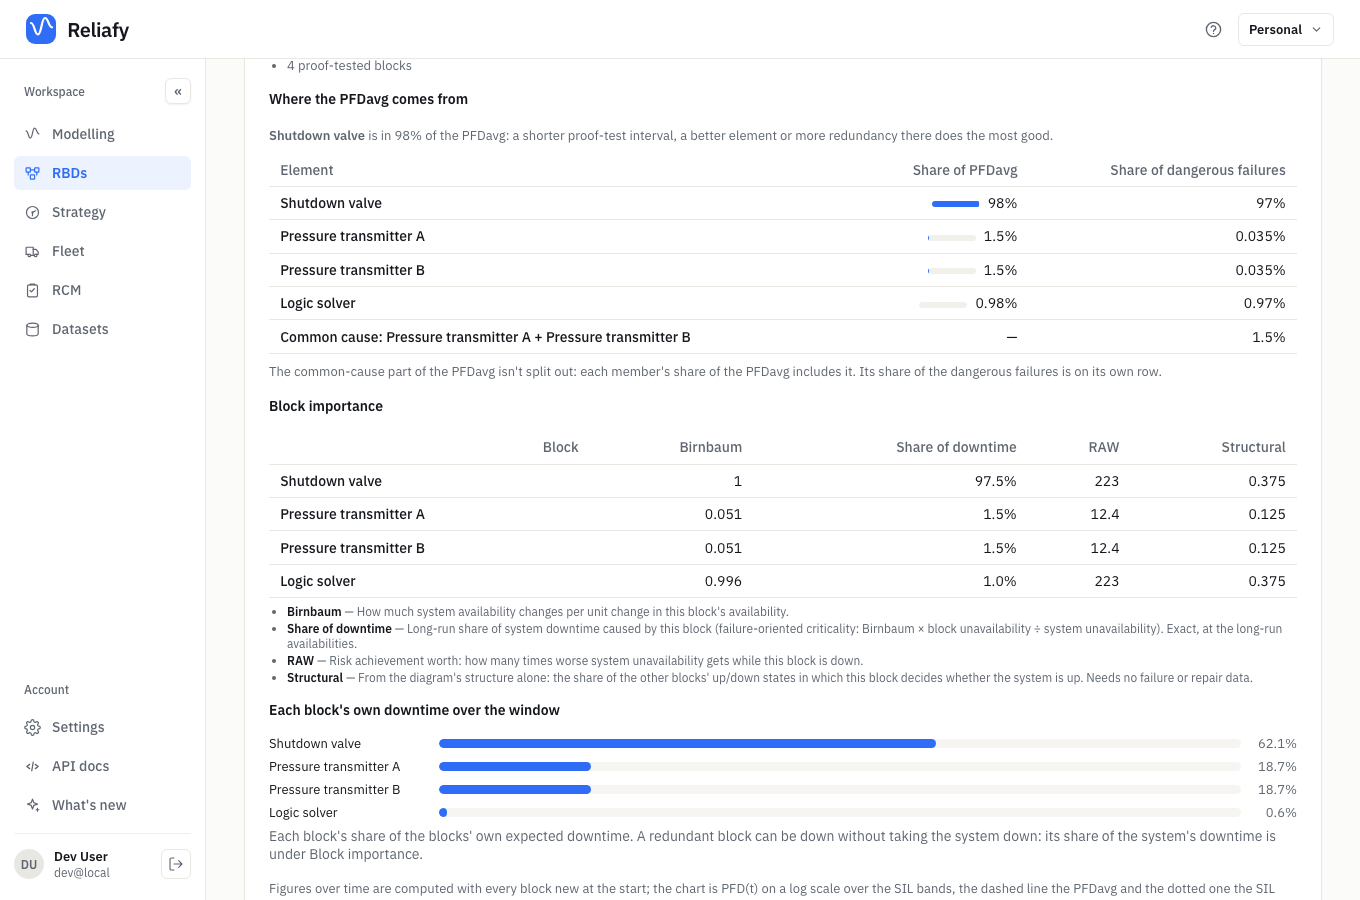
The single shutdown valve is in 98% of the PFDavg. The transmitters are in 1.5% each, the logic solver in 0.98%, and the transmitters' common cause is 1.5% of the dangerous failures. What to improve, above Details, ranks the same thing as changes: a shorter proof-test interval on the valve first, a better valve second, the transmitters' β a distant third.
So the redundant pair at the front of the loop, the part that usually gets the attention, is barely in the answer. The valve is the function.
Five changes, one at a time
Each change below starts from the starter, and every figure is the app's PFDavg after recalculating.
A second shutdown valve: SIL 3
Select the valve, choose + Add block → Add alongside (in parallel), and give the new block the same λDU (1e-6 per hour) and a yearly proof test. The two valves now vote 1oo2.
PFDavg falls to 1.37e-4: SIL 3, at 14% of the SIL 3 limit of 0.001. The shares flip. The transmitters are now in 49% of the PFDavg each, and their common cause is 44% of the dangerous failures.
Raising β to 10%
On the starter, raising the transmitters' β from 5% to 10% moves the PFDavg from 0.00448 to 0.00454. That's barely a change, because the transmitters were never the problem.
With two valves it matters. The same change to the transmitters' β takes the two-valve loop from 1.37e-4 to 2.02e-4. Two valves of one type, on one line and tested by one crew, are rarely independent. Select both, choose Common-cause group and give β = 10%: the PFDavg rises to 5.70e-4. That's still SIL 3, but four times the independent figure, and the valves' common cause is now 75% of the dangerous failures. β matters exactly where redundancy is doing the work, and that is where it deserves as much care as λDU.
Imperfect proof-test coverage
A proof test rarely finds every dangerous failure. A valve test might confirm the valve moves but not that it seals. In the valve's Proof test, set Coverage, the share of failures a test finds, and Full test every, how often a complete test finds the rest.
With 90% coverage and a full test every 10 years (87,600 hours), the PFDavg is 0.00838: still SIL 2, but at 84% of the limit. At 70% coverage it's 0.0161: SIL 1, and the target is missed. The failures a yearly test misses wait up to ten years to be found. The rough check is C·λT₁/2 + (1 − C)·λT₂/2. At 70% that gives 0.7 × 0.00438 + 0.3 × 0.0438 = 0.0162 for the valve alone.
A shorter test interval
Test the valve every six months (4,380 hours) instead of yearly, and the PFDavg nearly halves to 0.00230, at 23% of the SIL 2 limit. Test all four elements every six months and it's 0.00224. Almost all of the gain comes from the one element that dominates, so the shares table tells you which tests to move.
To have Reliafy choose the intervals for you, the Design tab's Maintenance and proof-test intervals finds the intervals, staggered or together, that reach a target SIL at the least cost.
What this doesn't check
The PFDavg is one requirement of a SIL, not all of them. Reliafy doesn't check the architectural constraints (hardware fault tolerance), systematic capability or the demand rate, so confirm those against IEC 61511 separately. And the result is only as good as the λDU, β and coverage you give it. Those deserve a source you can cite, not a default.
Try it
Open the RBDs page and choose Verify a safety function (SIL / PFDavg). Calculate the starter as it is, then rename the blocks and enter your own loop. The step-by-step guide, Verify a safety function, covers each setting. Common-cause failure and the beta-factor model explains β. Download as Python in the Save menu exports the diagram as a script that prints the same PFDavg and SIL.