Check a requirement and plan a demonstration test
Before you start: A B-life requirement and, ideally, a fitted life model of the item.
Requirements usually arrive as one line in a specification: B10 of at least 500 hours, at 90% confidence. That's two questions. Do the data you have already show it? And if they don't, how many units do you have to test, for how long, to show it?
Reliafy answers the first from a fitted life model and the second with the demonstration test planner, and one leads straight into the other. This guide uses the sample bearing model (a Weibull fit to 30 failure times) and the requirement B10 ≥ 500 hours at 90% confidence.
Check the requirement against the model
Open the model. At the foot of the Life card is a Requirement row: click Check. Enter the B-life as the percent failed (10 for B10) and the Required life (500 hours). The Confidence is the Life card's, 90% here. Press Check.
The requirement is judged on the lower bound, not the estimate, so a pass holds at that confidence:
✕ Does not meet: at 90% confidence B10 ≥ 467 hours, below the 500 required. Best estimate 582.
The best estimate meets it, but these data can't show it at 90% confidence yet: more data or a demonstration test could.
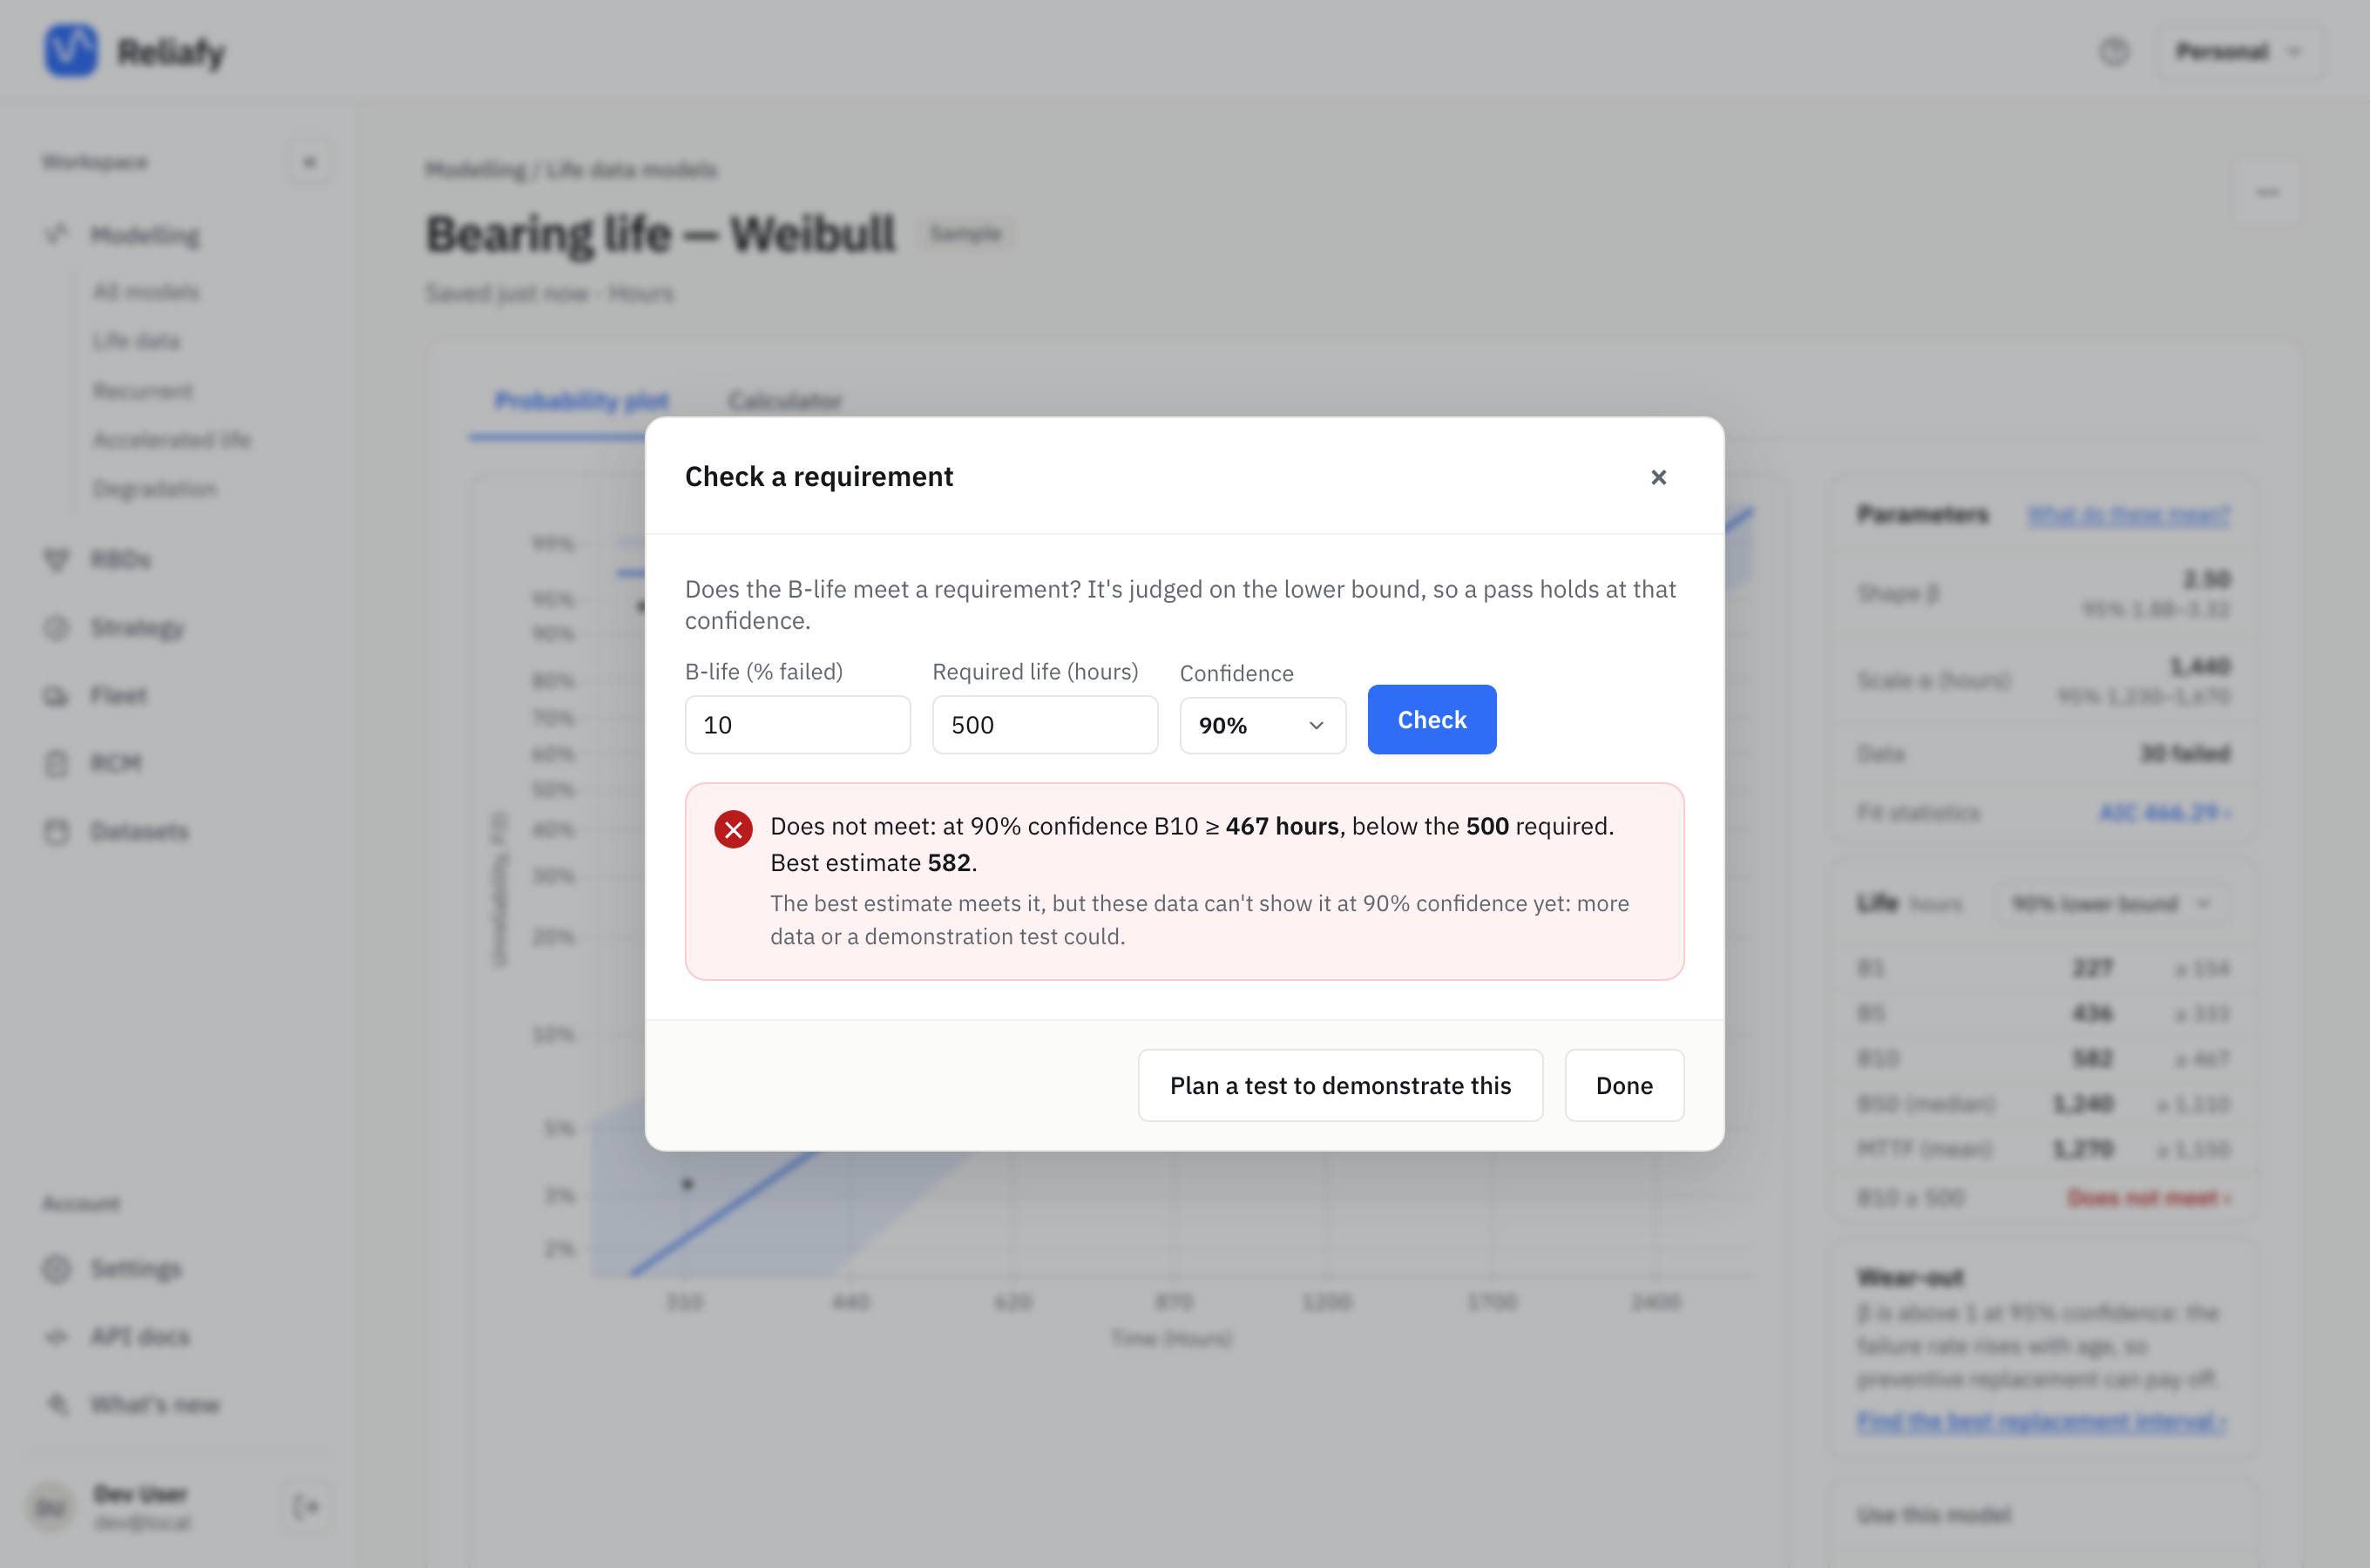
This is the common, frustrating case: the bearings probably are good enough (582 > 500), but 30 failures can't prove it at 90%. Try 450 hours instead and the verdict is Meets: 467 is at or above 450. The row on the Life card keeps the answer (B10 ≥ 500 · Does not meet) while you stay on the model.
A lower confidence would pass sooner, but the confidence is part of the requirement, so change it only if the specification allows. To see how the bounds move with confidence, read B-lives and confidence bounds.
Plan a test to demonstrate it
When the verdict is Does not meet, Plan a test to demonstrate this opens Strategy → Demonstration test with the requirement already filled in: a pass/fail test of B10 ≥ 500 hours at 90%, in hours, solving for the number of units to test. It also offers the model's Weibull shape: β from Bearing life — Weibull (sample): 2.5, 95% interval 1.88–3.32.
Press Compute with 0 failures allowed and a test length of 1× the life:
Test 22 units for 500 hours each; pass if none fail.
That's the classic success run: if 22 units all survive 500 hours, B10 ≥ 500 is shown at 90% confidence. It needs no assumption about the distribution, which is its strength and its cost.
Make it shorter or smaller with a known shape
If you're willing to assume the Weibull shape, each unit can be tested for longer than the requirement, and one long survivor counts for more than one short one (the extended success run, or Weibayes). Choose Lower bound 1.88 (conservative) for β, set the Test length per unit to 2 (× the life), and compute:
Test 6 units for 1,000 hours each; pass if none fail.
Six units instead of 22, at the price of 1,000 hours on test each. Use the lower bound of β rather than the estimate: if the true shape is lower than assumed, the test demonstrates less than it claims, and the plan's Assumptions say so.
Keep a good design from failing the test
A zero-failure test sized only for the consumer's risk has a catch: a design that is genuinely good can still fail it by bad luck. The result says how likely that is for a design exactly at the target (it passes 9.8% of the time), but not for a better one.
Fill in Design's true reliability (the reliability you expect the design really has at 500 hours, say 97%) and a Producer's risk (the chance you accept of failing that good design, say 20%). The plan now chooses the failures allowed as well:
Test 19 units for 1,000 hours each; pass if ≤ 3 fail.
A design at the target still passes 9.7% of the time; one with 97% reliability fails 13.4%.
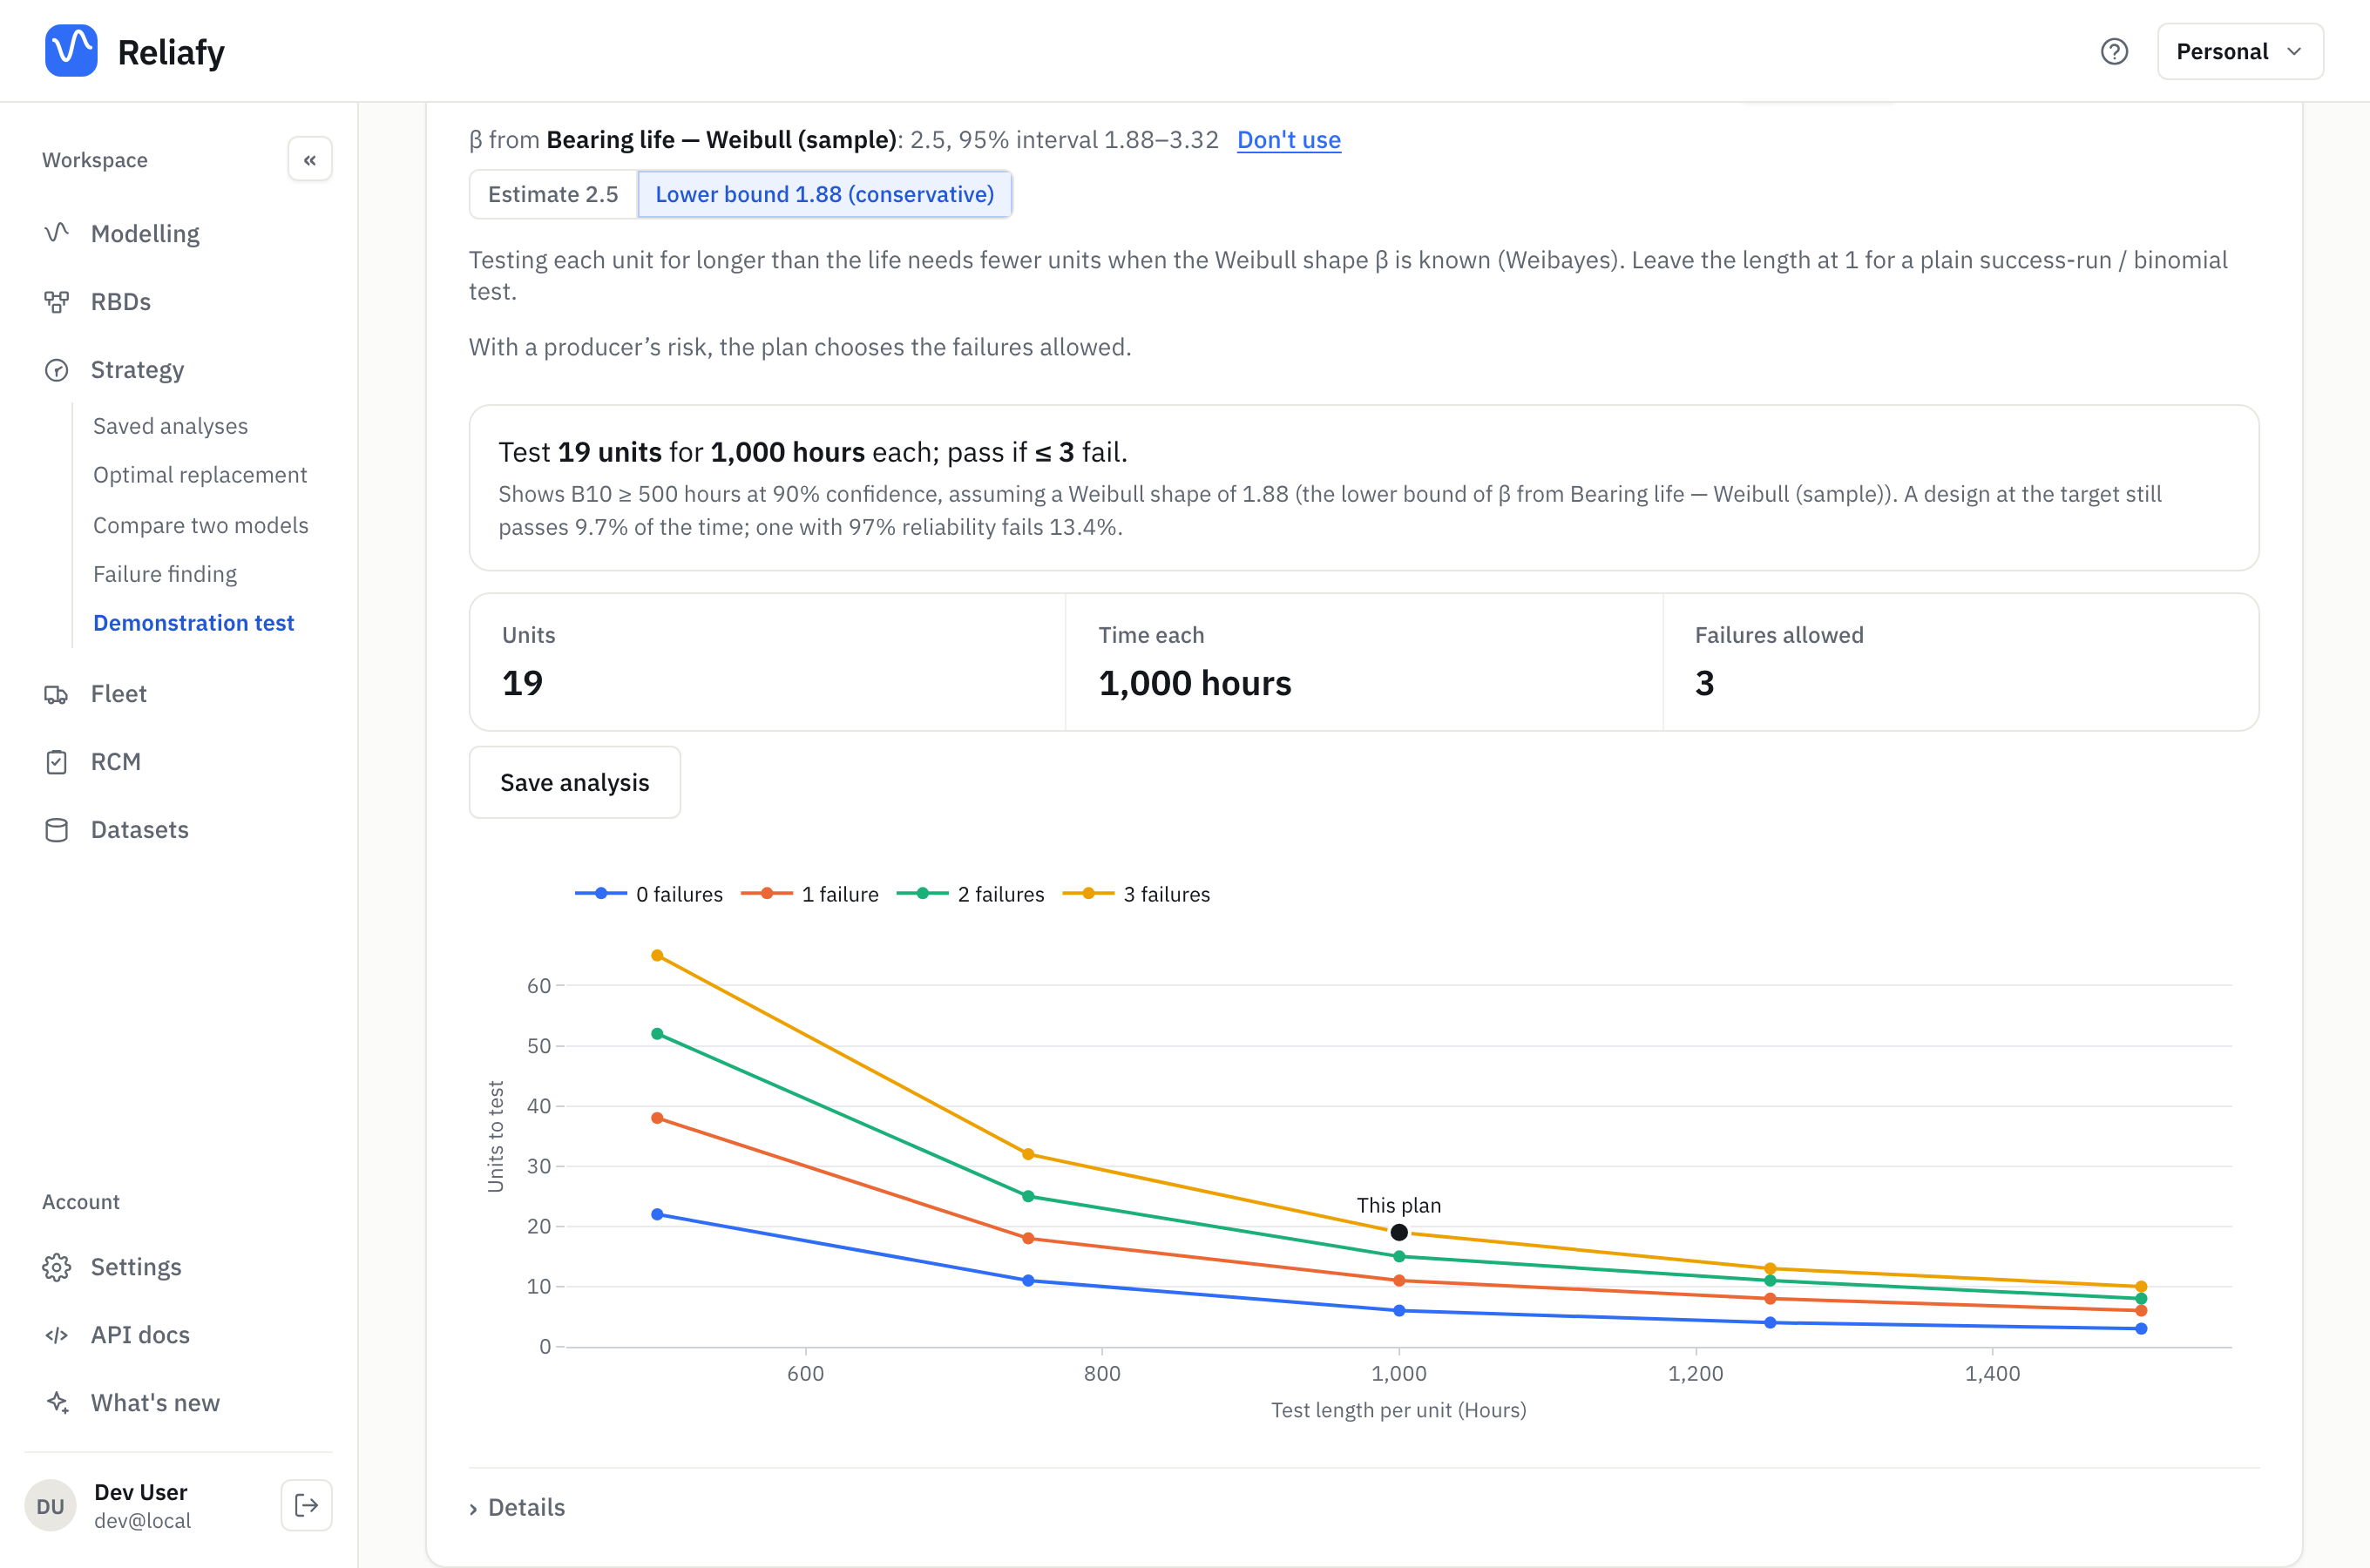
More units, but a test a good design will pass 87% of the time instead of being a gamble.
Weigh the trade-off
The chart under the plan is the whole trade-off: the units to test against the test length per unit, one line for each number of failures allowed, with this plan marked. Details gives the same as a table, test lengths from 1× to 3× the life: at 1× and 0 failures it's 22 units; at 3× it's 3. The Operating characteristic chart below plots the chance of passing against the design's true reliability, with the target and the good design marked: the two risks of the test, in one picture.
Save analysis keeps the plan under Strategy → Saved analyses, so the reasoning behind the test is on record when someone asks why it's 19 units.
Without a model
The planner works without a fitted model too: open Strategy → Demonstration test directly and type the requirement. Choose Reliability over a mission for a requirement written as a reliability ("R ≥ 95% over 2,000 hours"), or the MTBF (constant rate) test type for an MTBF requirement. Solve for can also give the test time per unit for a number of units you already have.