Read B-lives and confidence bounds
Before you start: A fitted life model. The sample bearing model works for following along.
A B-life is the time by which a given percentage of a population has failed. B10 is the time by which 10% have failed — equivalently, the time 90% survive to. It's the oldest life figure in reliability (it started with ball bearings) and still the most common way to write a requirement, because it talks about the early failures that hurt rather than the average that hides them.
Every B-life from a fitted model is an estimate. Thirty failure times can't pin a distribution down exactly, and a different thirty would give a slightly different answer. The confidence bound says how far the true value could plausibly be from the estimate. A B10 of 582 hours means something quite different when the data can only promise 467.
This guide reads both from the sample bearing model: a Weibull fit to 30 bearing failure times, with shape β = 2.50 and scale α = 1,440 hours.
The B-lives at a glance
Open the model. The Life card beside the probability plot lists the B1, B5, B10 and B50 lives and the mean life, each with its lower bound beside it:
| Estimate | 90% lower bound | |
|---|---|---|
| B1 | 227 hours | ≥ 154 |
| B5 | 436 hours | ≥ 333 |
| B10 | 582 hours | ≥ 467 |
| B50 (median) | 1,240 hours | ≥ 1,110 |
| MTTF (mean) | 1,270 hours | ≥ 1,150 |
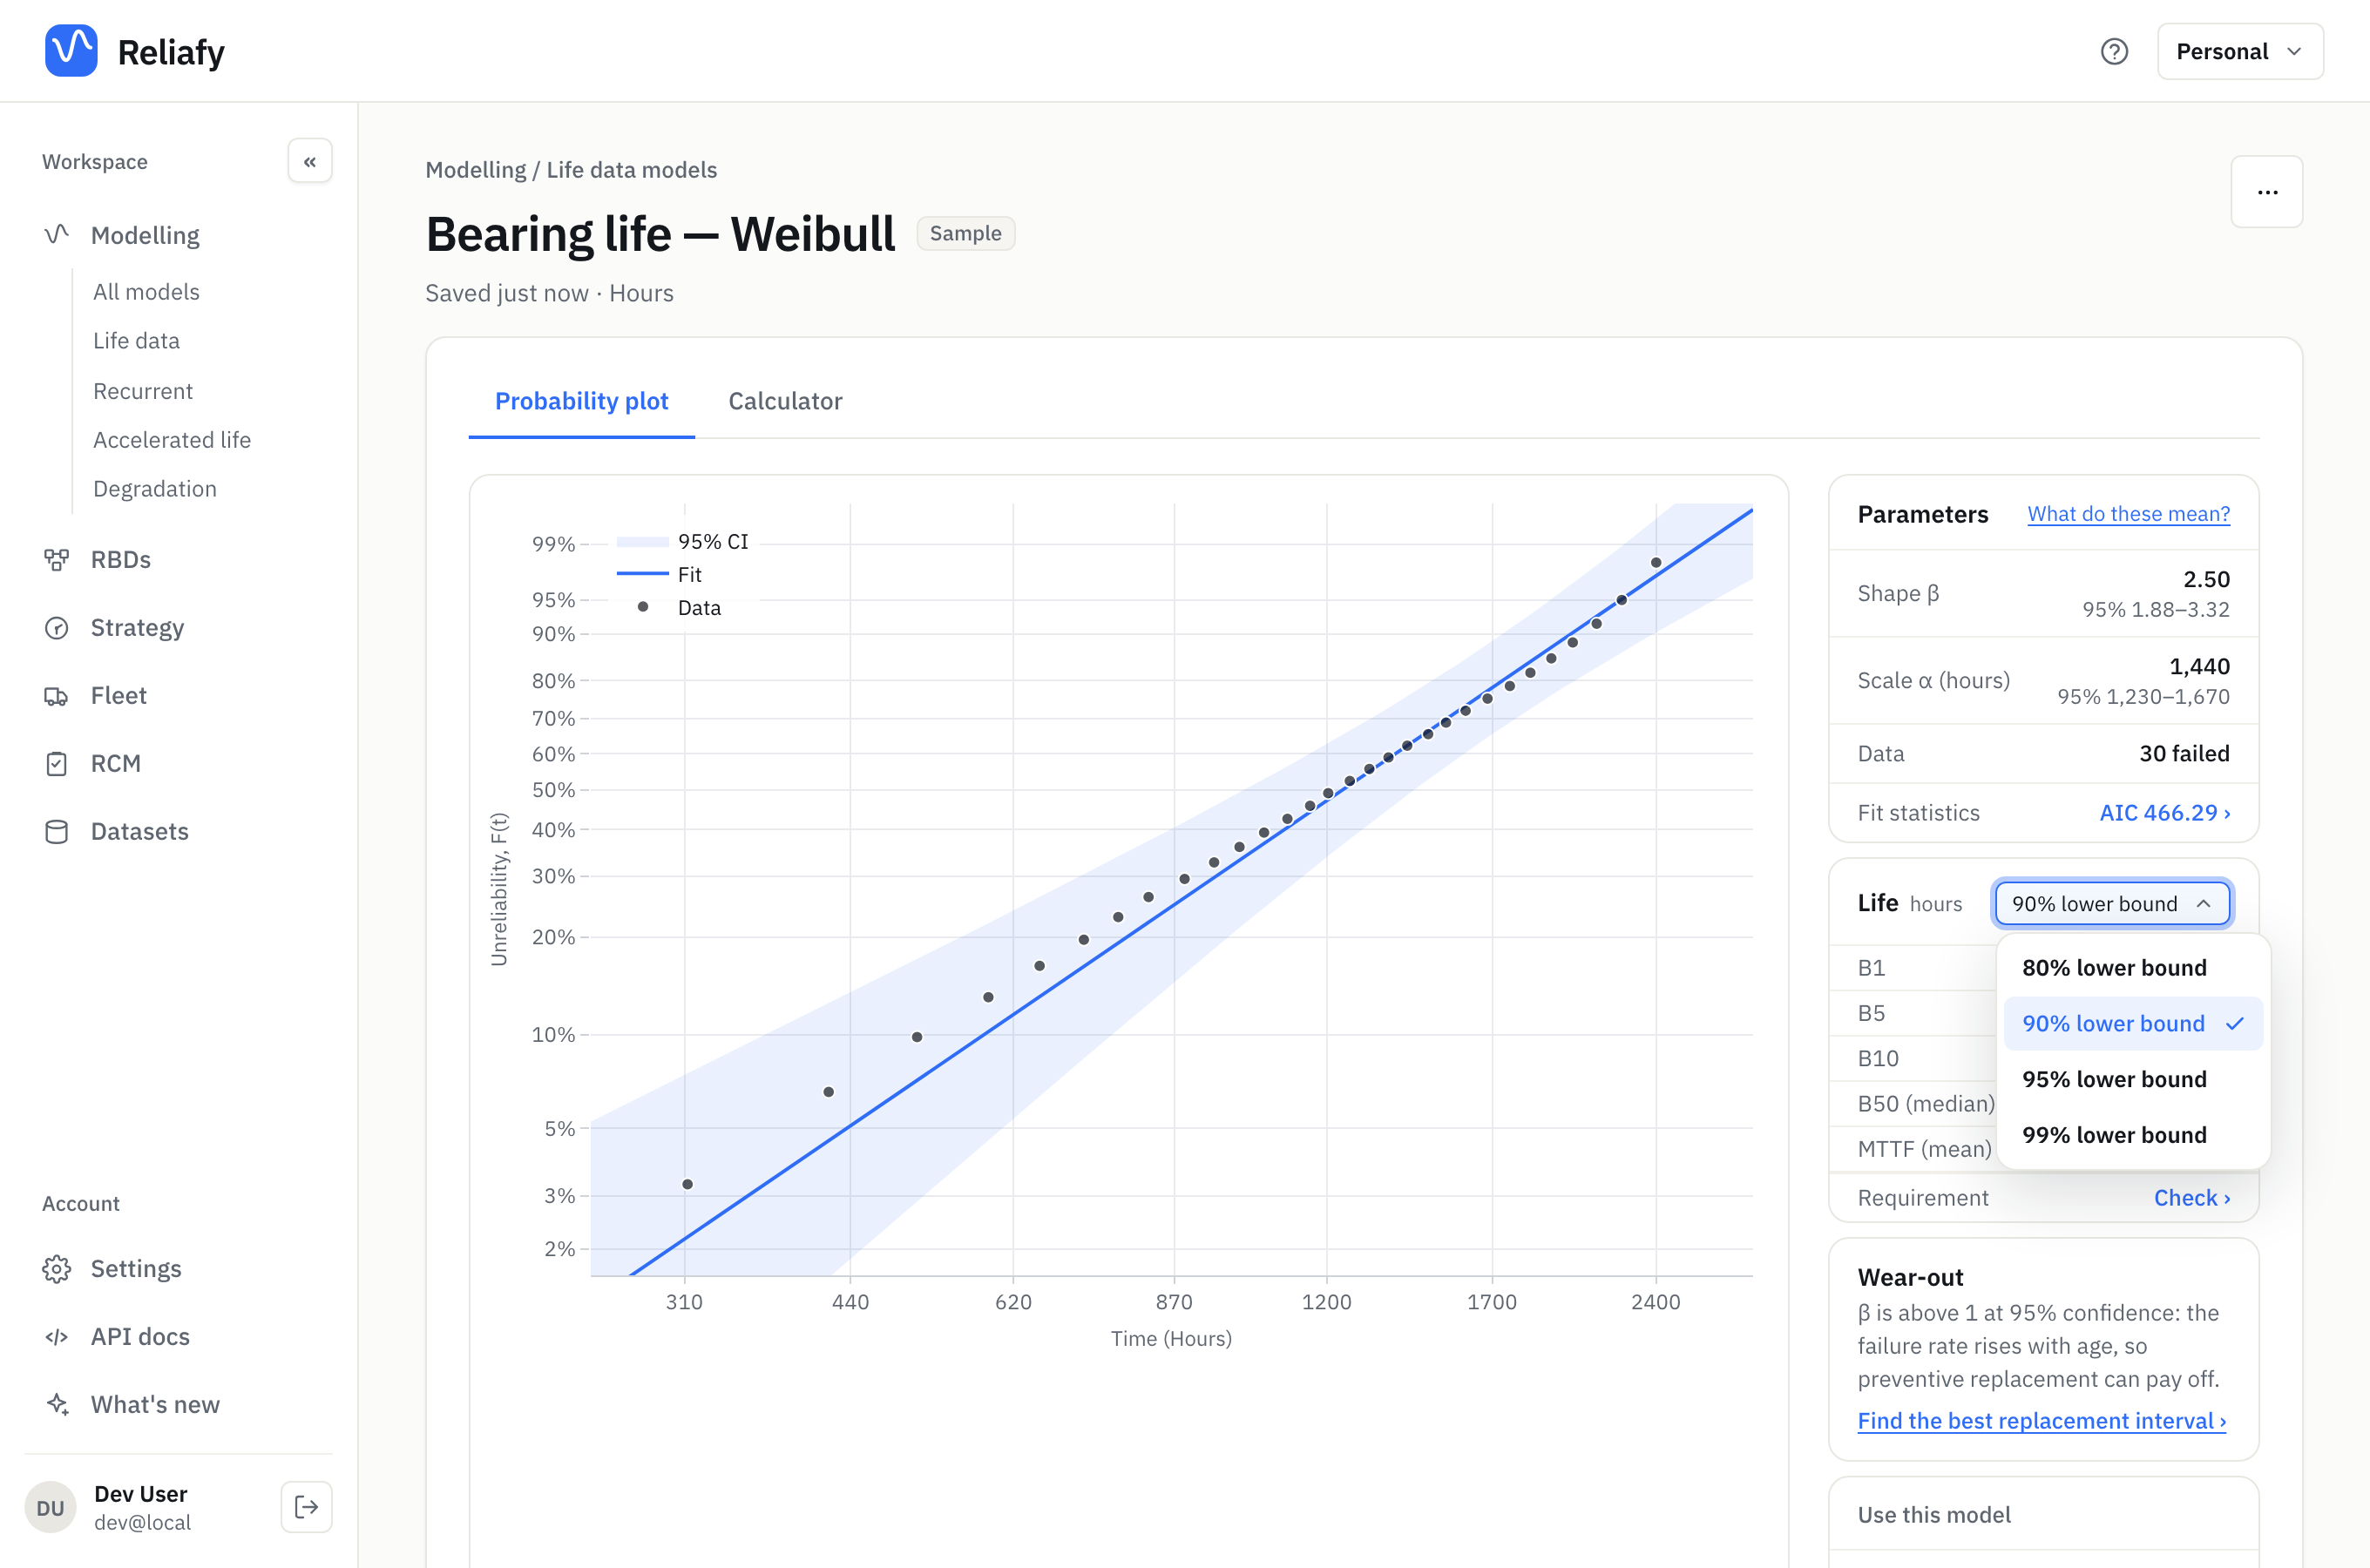
Read the B10 row as: our best estimate is that 10% fail by 582 hours, and we're 90% sure that 10% haven't failed before 467. The bound is the number to plan with when an early failure is expensive; the estimate is the number to expect.
The chooser at the top of the card sets the confidence: 80%, 90%, 95% or 99% lower bound. A higher confidence moves the bound further from the estimate — you're asking for more certainty, so you get a more cautious number. The same confidence is used everywhere on the page, including the requirement check.
Any B-life, any bound
For a percentage the card doesn't list, use the Calculator tab and choose Time at reliability. Enter the reliability you want to keep — 90% for B10, 99% for B1, 97.5% for a B2.5 — and the answer is stated in words above the curve:
Time when reliability falls to 90% (the B10 life): 582 hours — we're 90% sure it's at least 467 hours
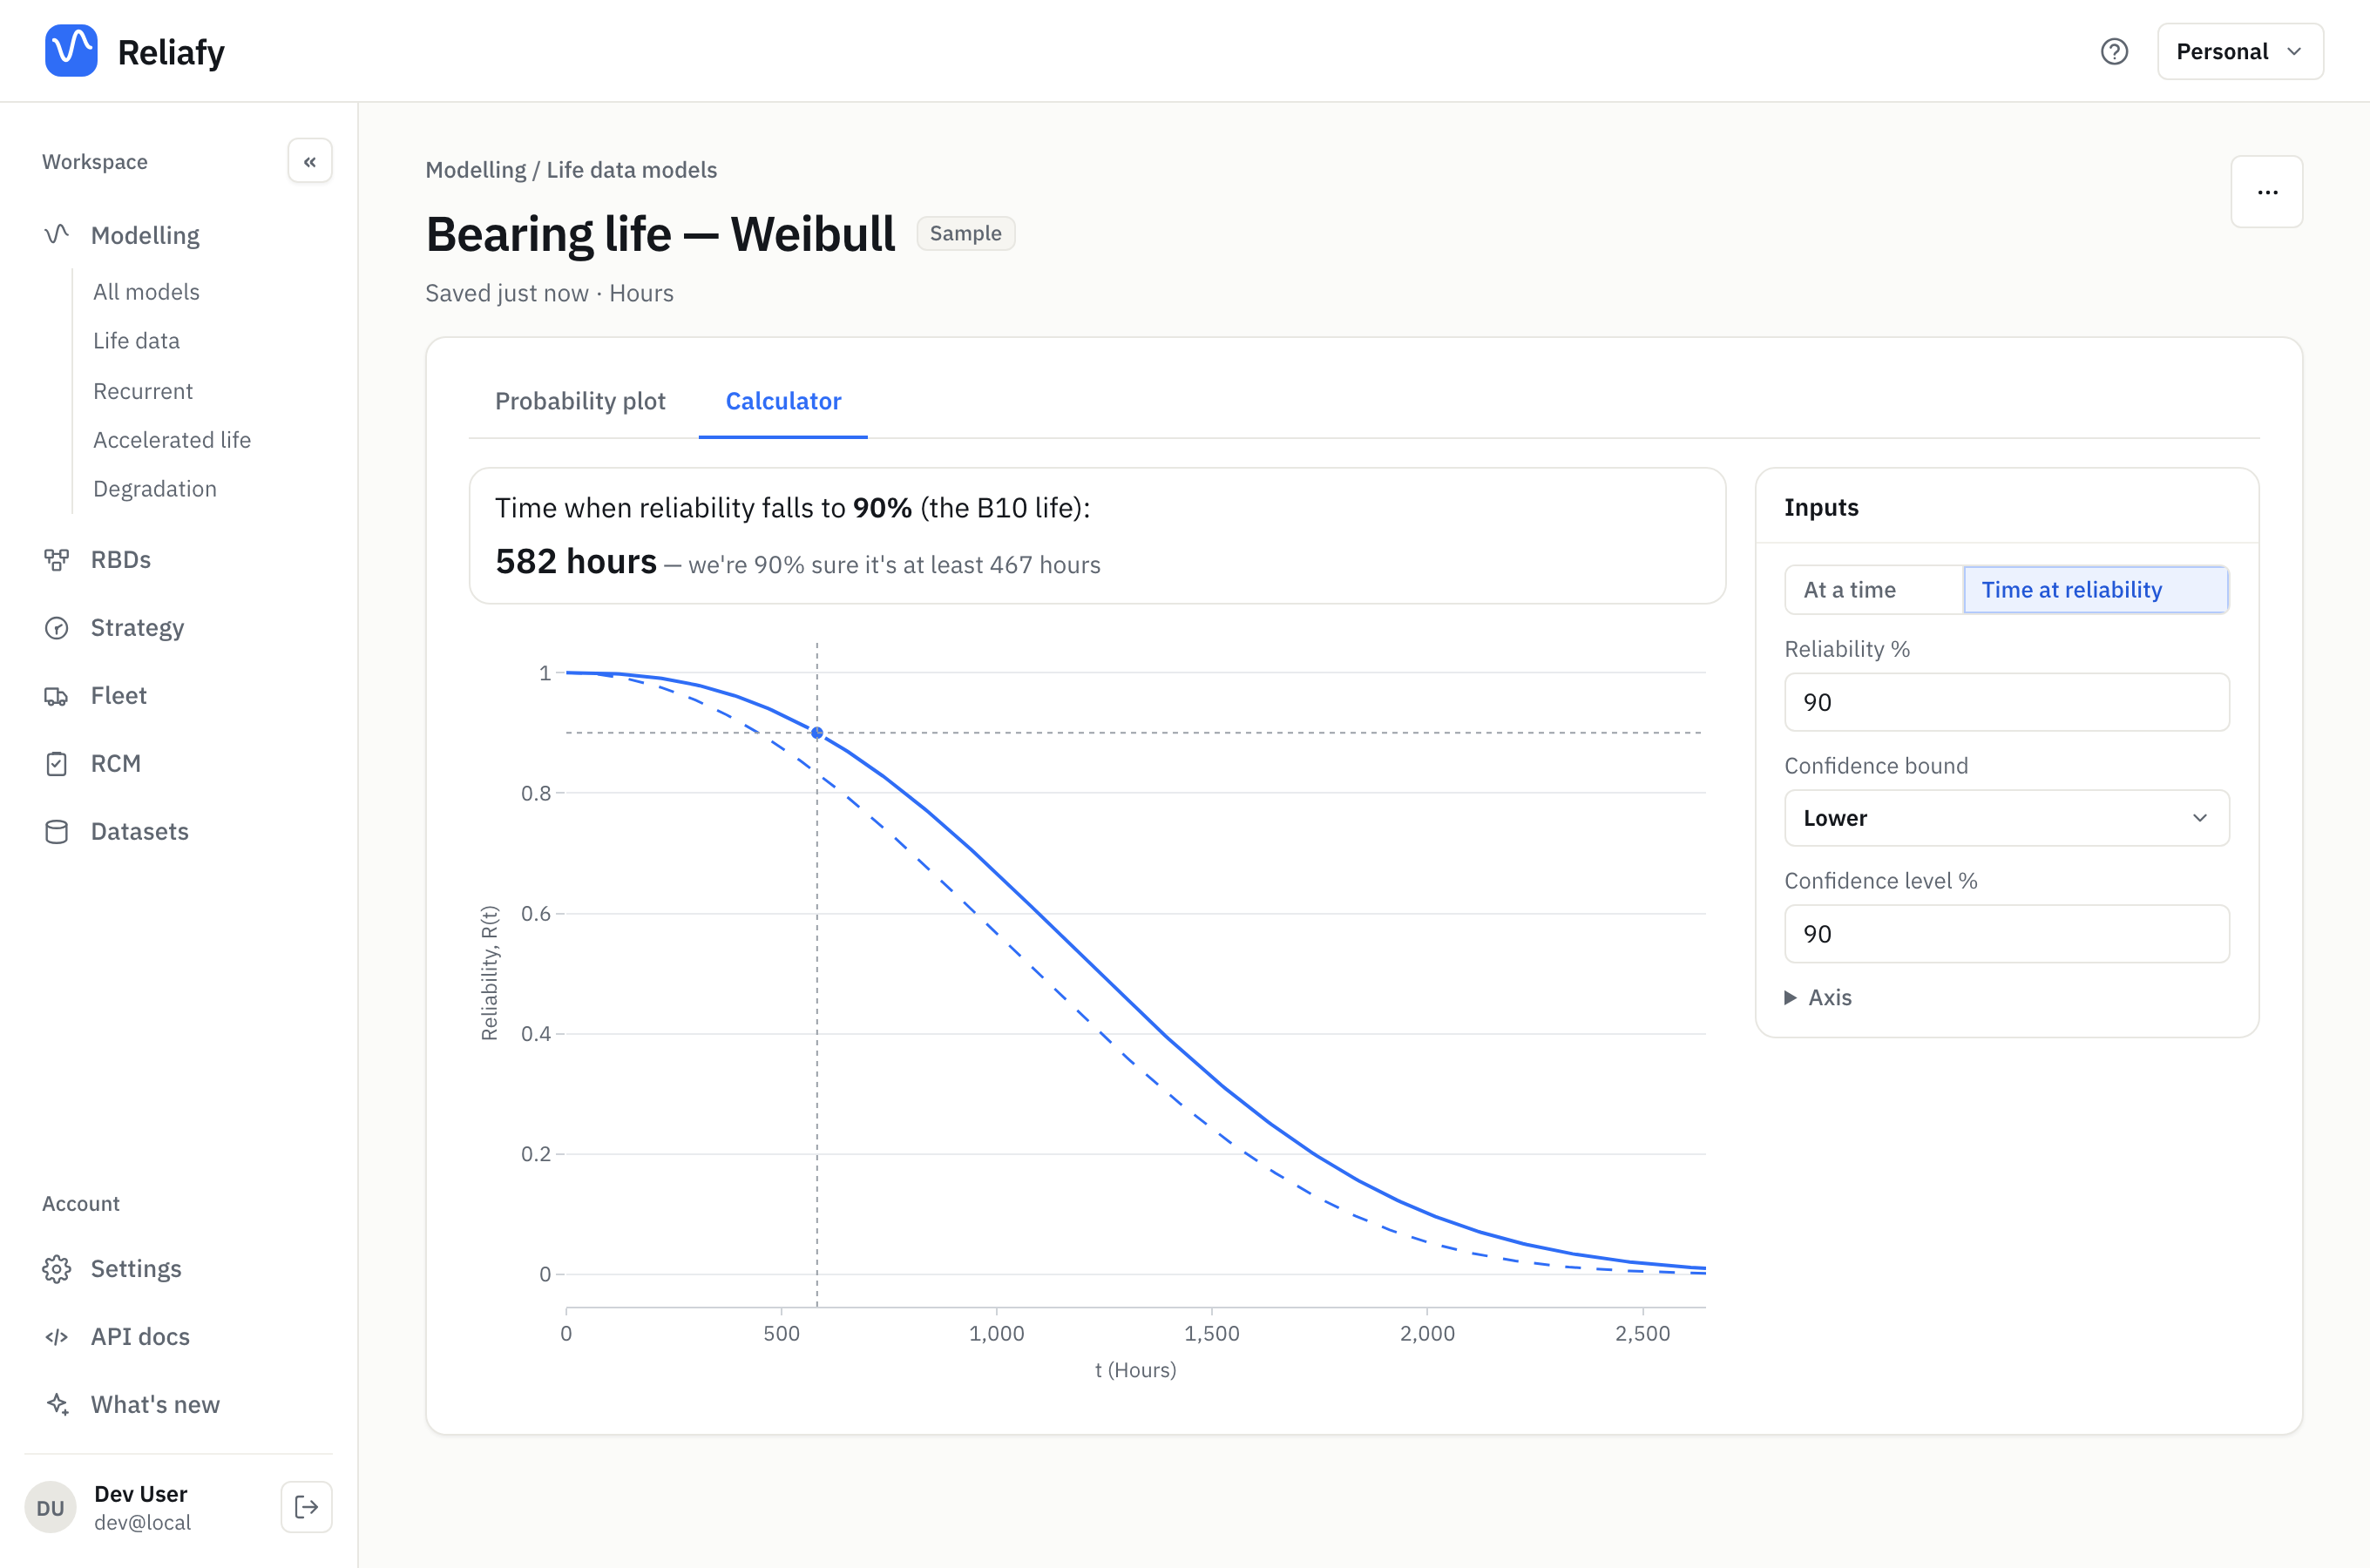
Confidence bound chooses which bound you get:
- Lower — "at least". Use it for a life you must not overrun: a replacement interval, a warranty, a requirement.
- Upper — "at most". Use it when the risk is on the other side, such as how long before a spares stock is used up.
- Two-sided — an interval. With 90% two-sided, B10 is between 439 and 773 hours.
- None — the estimate alone.
Note that a 90% two-sided interval is wider at each end than a 90% one-sided bound: its lower end, 439, is the 95% lower bound, because the 10% that a two-sided interval leaves out is split between the two tails.
The same goes the other way round. Switch to At a time, enter 1,000 hours, and the calculator gives the reliability there: 67%, at least 57% at 90% confidence (one-sided), or between 53% and 77% (two-sided).
Where the bounds come from
The bounds come from the fit's own uncertainty: how sharply the data pin down the parameters, carried through to the B-life. Three things make them tighter:
- More failures. The width shrinks roughly with the square root of the number of failures, so halving it takes about four times the data.
- Units still running. Survivors add information, especially about the upper B-lives — so map the censoring column rather than dropping them (see censored data).
- Asking about the middle. B50 is better known than B1, because most of the data sit in the middle of the distribution. The table shows it: the B1 bound is 68% of its estimate, the B50 bound 90%.
That last point matters for requirements. A B1 or B0.1 requirement asks about the tail where you have the least data, so its bound sits a long way below the estimate unless you have a lot of failures — or a test designed to show it.
B-lives of a system
A reliability block diagram has B-lives too. In the RBD Calculator, the tiles show the system's B10 life and B50 life, and Design life at R (%) gives the time the system keeps a reliability you choose: for the sample pump station, R ≥ 90% until 318 hours, the system's B10. Turn on the Confidence band to carry the uncertainty of the blocks' fitted models (saved models, not typed-in parameters) through to the system's curve, MTTF and B-lives.
Where to go next
To check a B-life against a number someone has written down — "B10 of at least 500 hours at 90% confidence" — and plan a test when the data can't show it yet, see check a requirement and plan a demonstration test.