Rank running units by risk from their condition readings
Before you start: A Pro plan to fit a model. Failure and running ages for a set of units, and condition readings taken on them over time.
A life model treats every unit of a type alike: two pumps of the same age carry the same risk. But you know they don't. One pump's vibration has crept up for months; the other's is as steady as the day it went in. Condition-based risk uses those readings. It learns from your fleet how the reading drifts and how much a higher reading raises the chance of failing, then gives every unit still running its own risk, from its own readings.
It answers the questions a maintenance planner asks on Monday morning: which units are most likely to fail in the next month, and how long has each one got?
It differs from degradation modelling, which needs a threshold that counts as failure ("replace at 3 mm of pad"). Here the failures are real failures, and the model works out how the reading relates to them. No threshold is needed.
Your two tables
A model is fitted to two tables, both saved as datasets.
Lifetimes: one row per unit. Its id, its age when it failed (or its age now, if it is still running), whether it failed, and any facts about it that might matter, as numbers:
pump,age,running,load
P0,69.5,0,0
P1,63.3,0,1
P6,120,1,0
Readings: one row per reading. The unit's id, its age when it was read, and the value read:
pump,age,vibration
P0,0,1.96
P0,10,2.10
P0,20,2.36
Three rules keep the two tables in step:
- Ages are since new, in the same time unit in both tables. A reading at age 20 and a failure at age 69.5 are on one clock.
- The censoring flag is 0 = failed, 1 = still running. If your sheet uses 1 for failed, tick My flag is 1 = failed, 0 = still running rather than editing the data.
- The ids match. Every reading belongs to a unit in the lifetimes table.
If failures were found at inspections, so you only know a unit failed between two ages, tick Failures found at inspections and give both ages. Units that were already in service when your records began can take an Entry age.
Fit the model
Go to Modelling → Condition-based risk and press New model. Under 1. Your two tables, choose the two datasets, or upload or paste each one. Reliafy guesses the columns under 2. Columns; check them.
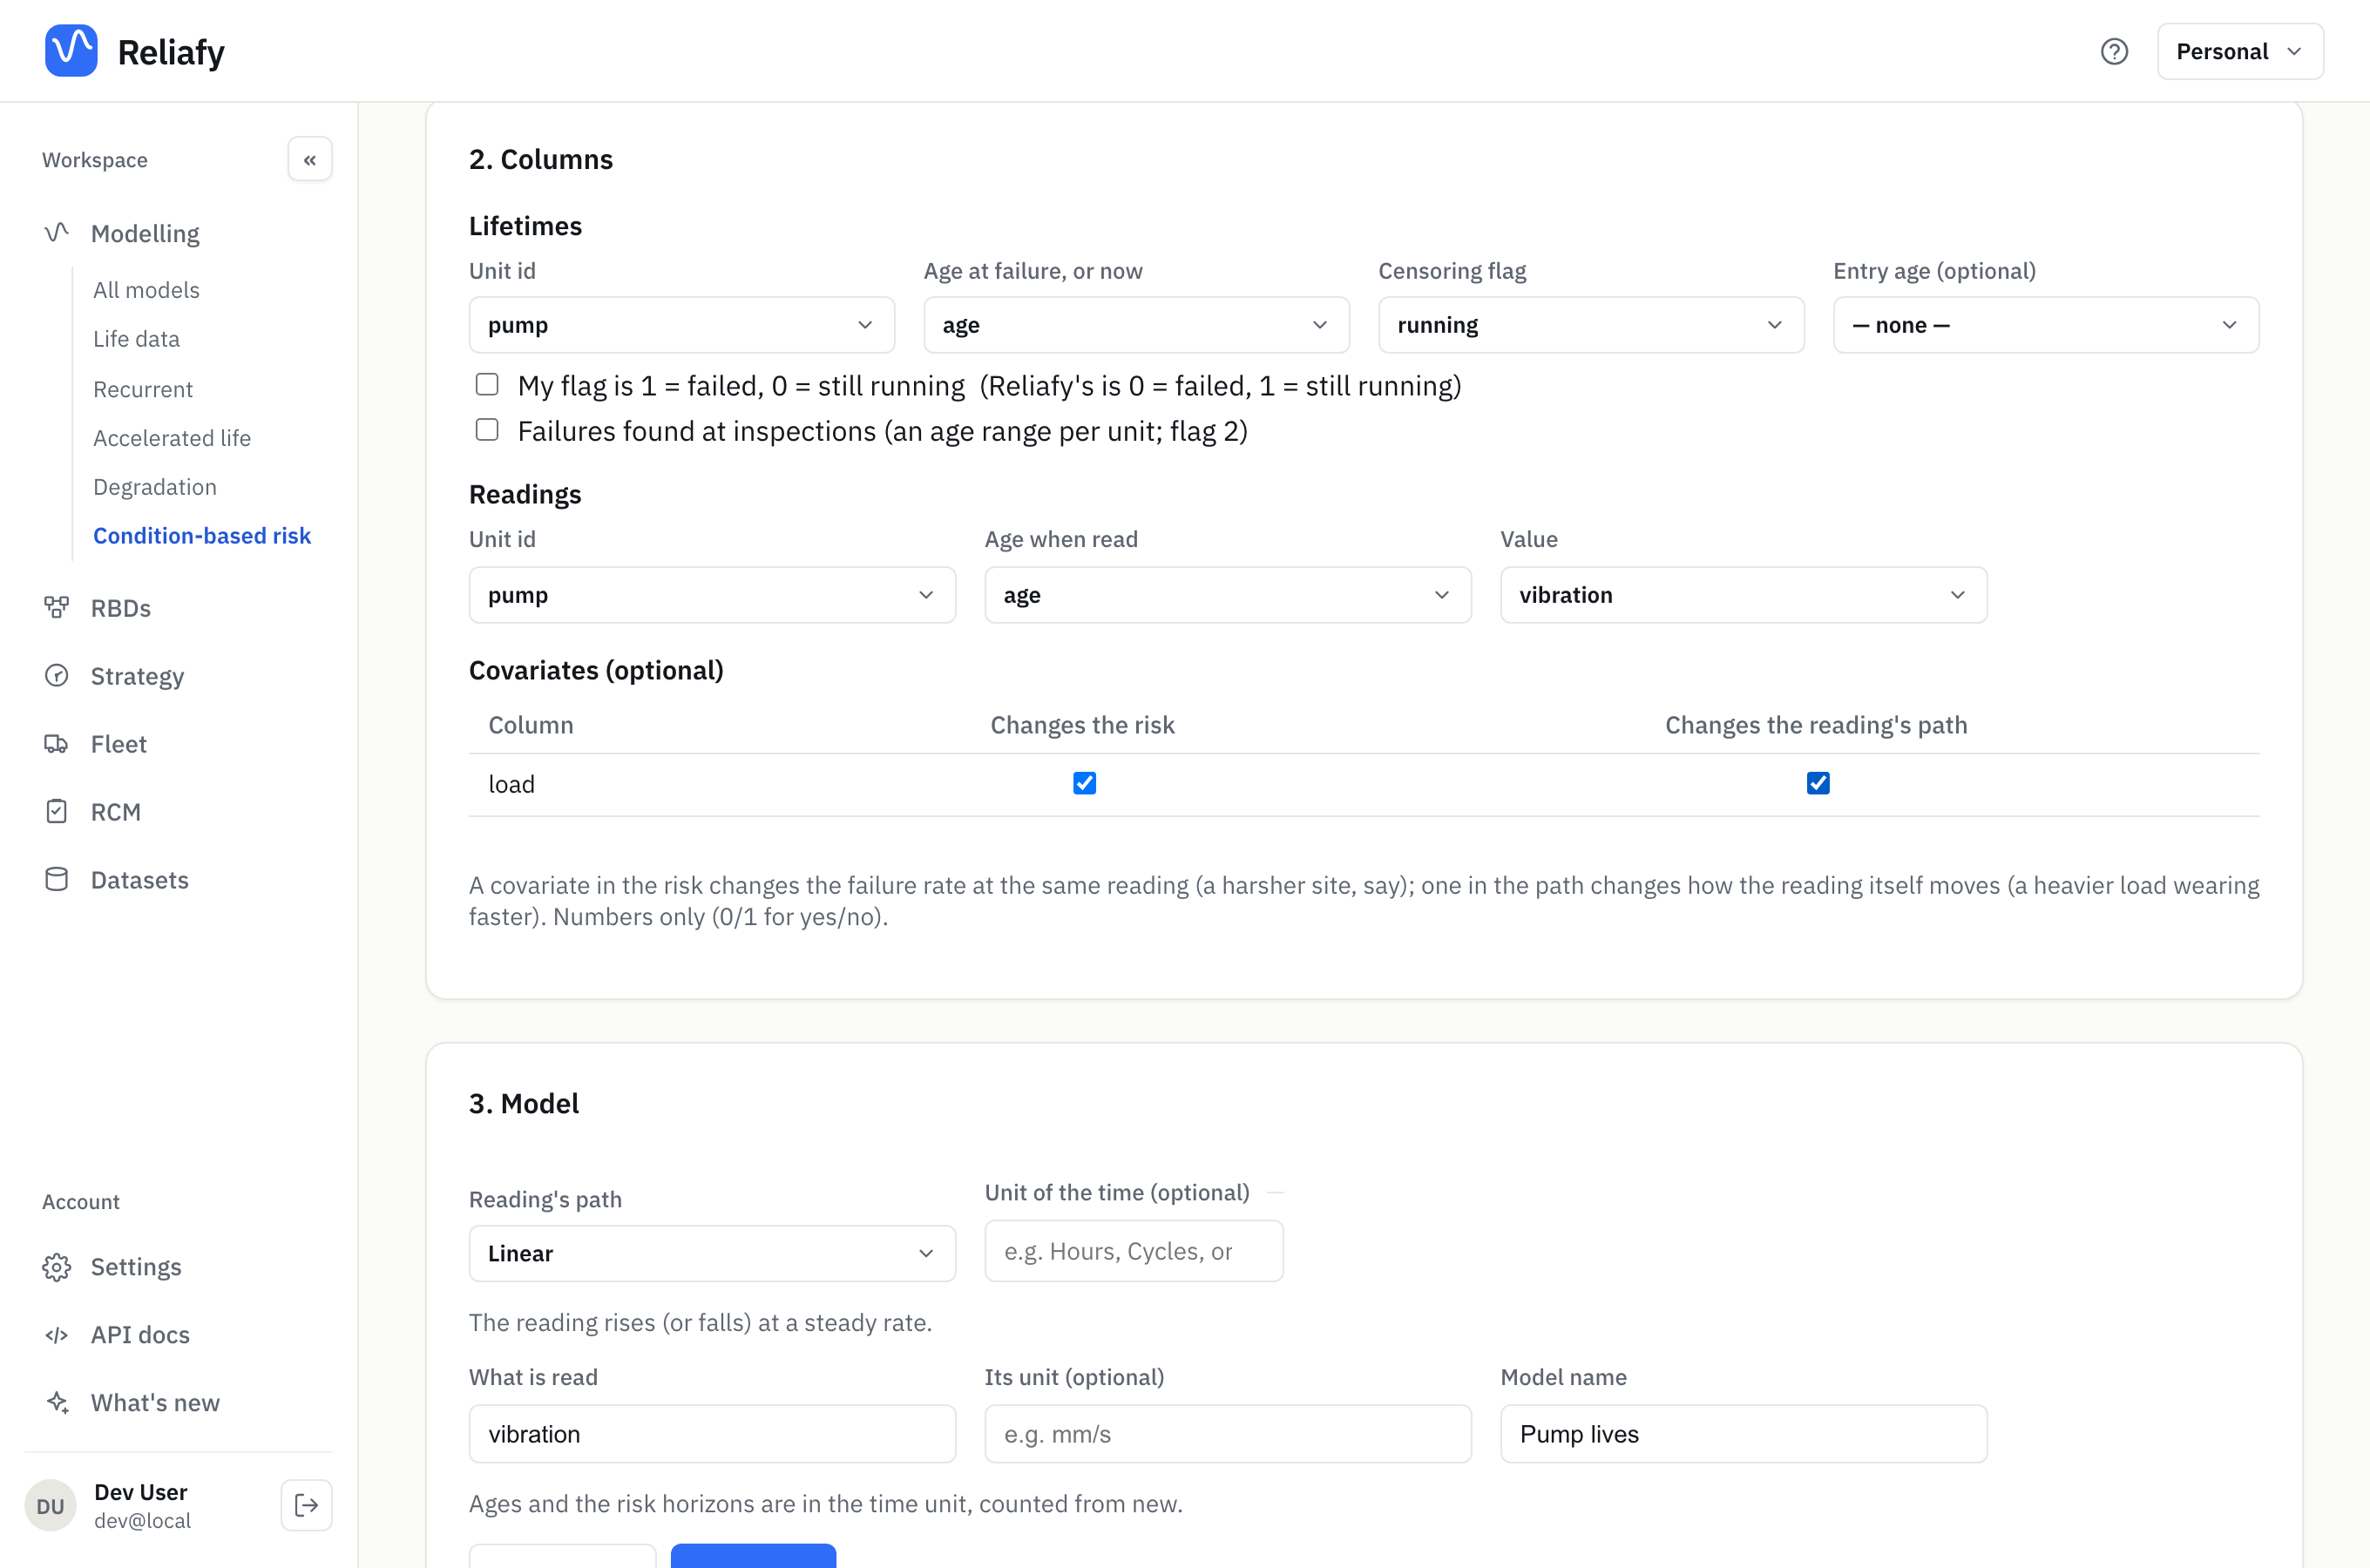
Covariates: risk or reading?
Any other numeric columns in the lifetimes table appear under Covariates, each with two boxes, because a fact about a unit can matter in two different ways:
- Changes the risk: at the same reading, the unit fails sooner. A harsher site, say, where a vibration of 4 mm/s is more dangerous than it is elsewhere.
- Changes the path: the reading itself moves differently. A heavier load makes the vibration climb faster.
The boxes read load changes the risk and load changes the path. Tick either or both. Leave a box empty when you have no reason to think the column matters that way: every extra effect needs more data to pin down. Use numbers only, 0 and 1 for yes and no.
The reading's path
Under 3. Model, the Reading's path describes how the reading drifts with age on a typical unit. Linear (a steady rise) is the default and the right start for most readings. Exponential suits a reading that grows by a fixed proportion, Power one that grows as a power of age, Logarithmic one that rises quickly then levels off, and Quadratic one whose rate of change itself changes with age (slower to fit). Each unit gets its own version of the path: its own starting level and its own rate.
Set the time unit, name what is read and its unit (vibration, mm/s), and press Check data. It counts the units, failures, running units and readings, and says if anything doesn't line up. Then press Fit model. A fleet takes from a few seconds to about a minute.
Read the risk table
The model opens on its answer: how many units it learnt from, and the running unit at the highest risk now.
Running units' risk lists every unit still in service, highest risk first, with its chance of failing in the next 30, 90 and 365 days (for a model in hours, days, weeks, months or years; other units get horizons in their own terms) and its Median life left: the time by which it has an even chance of having failed.
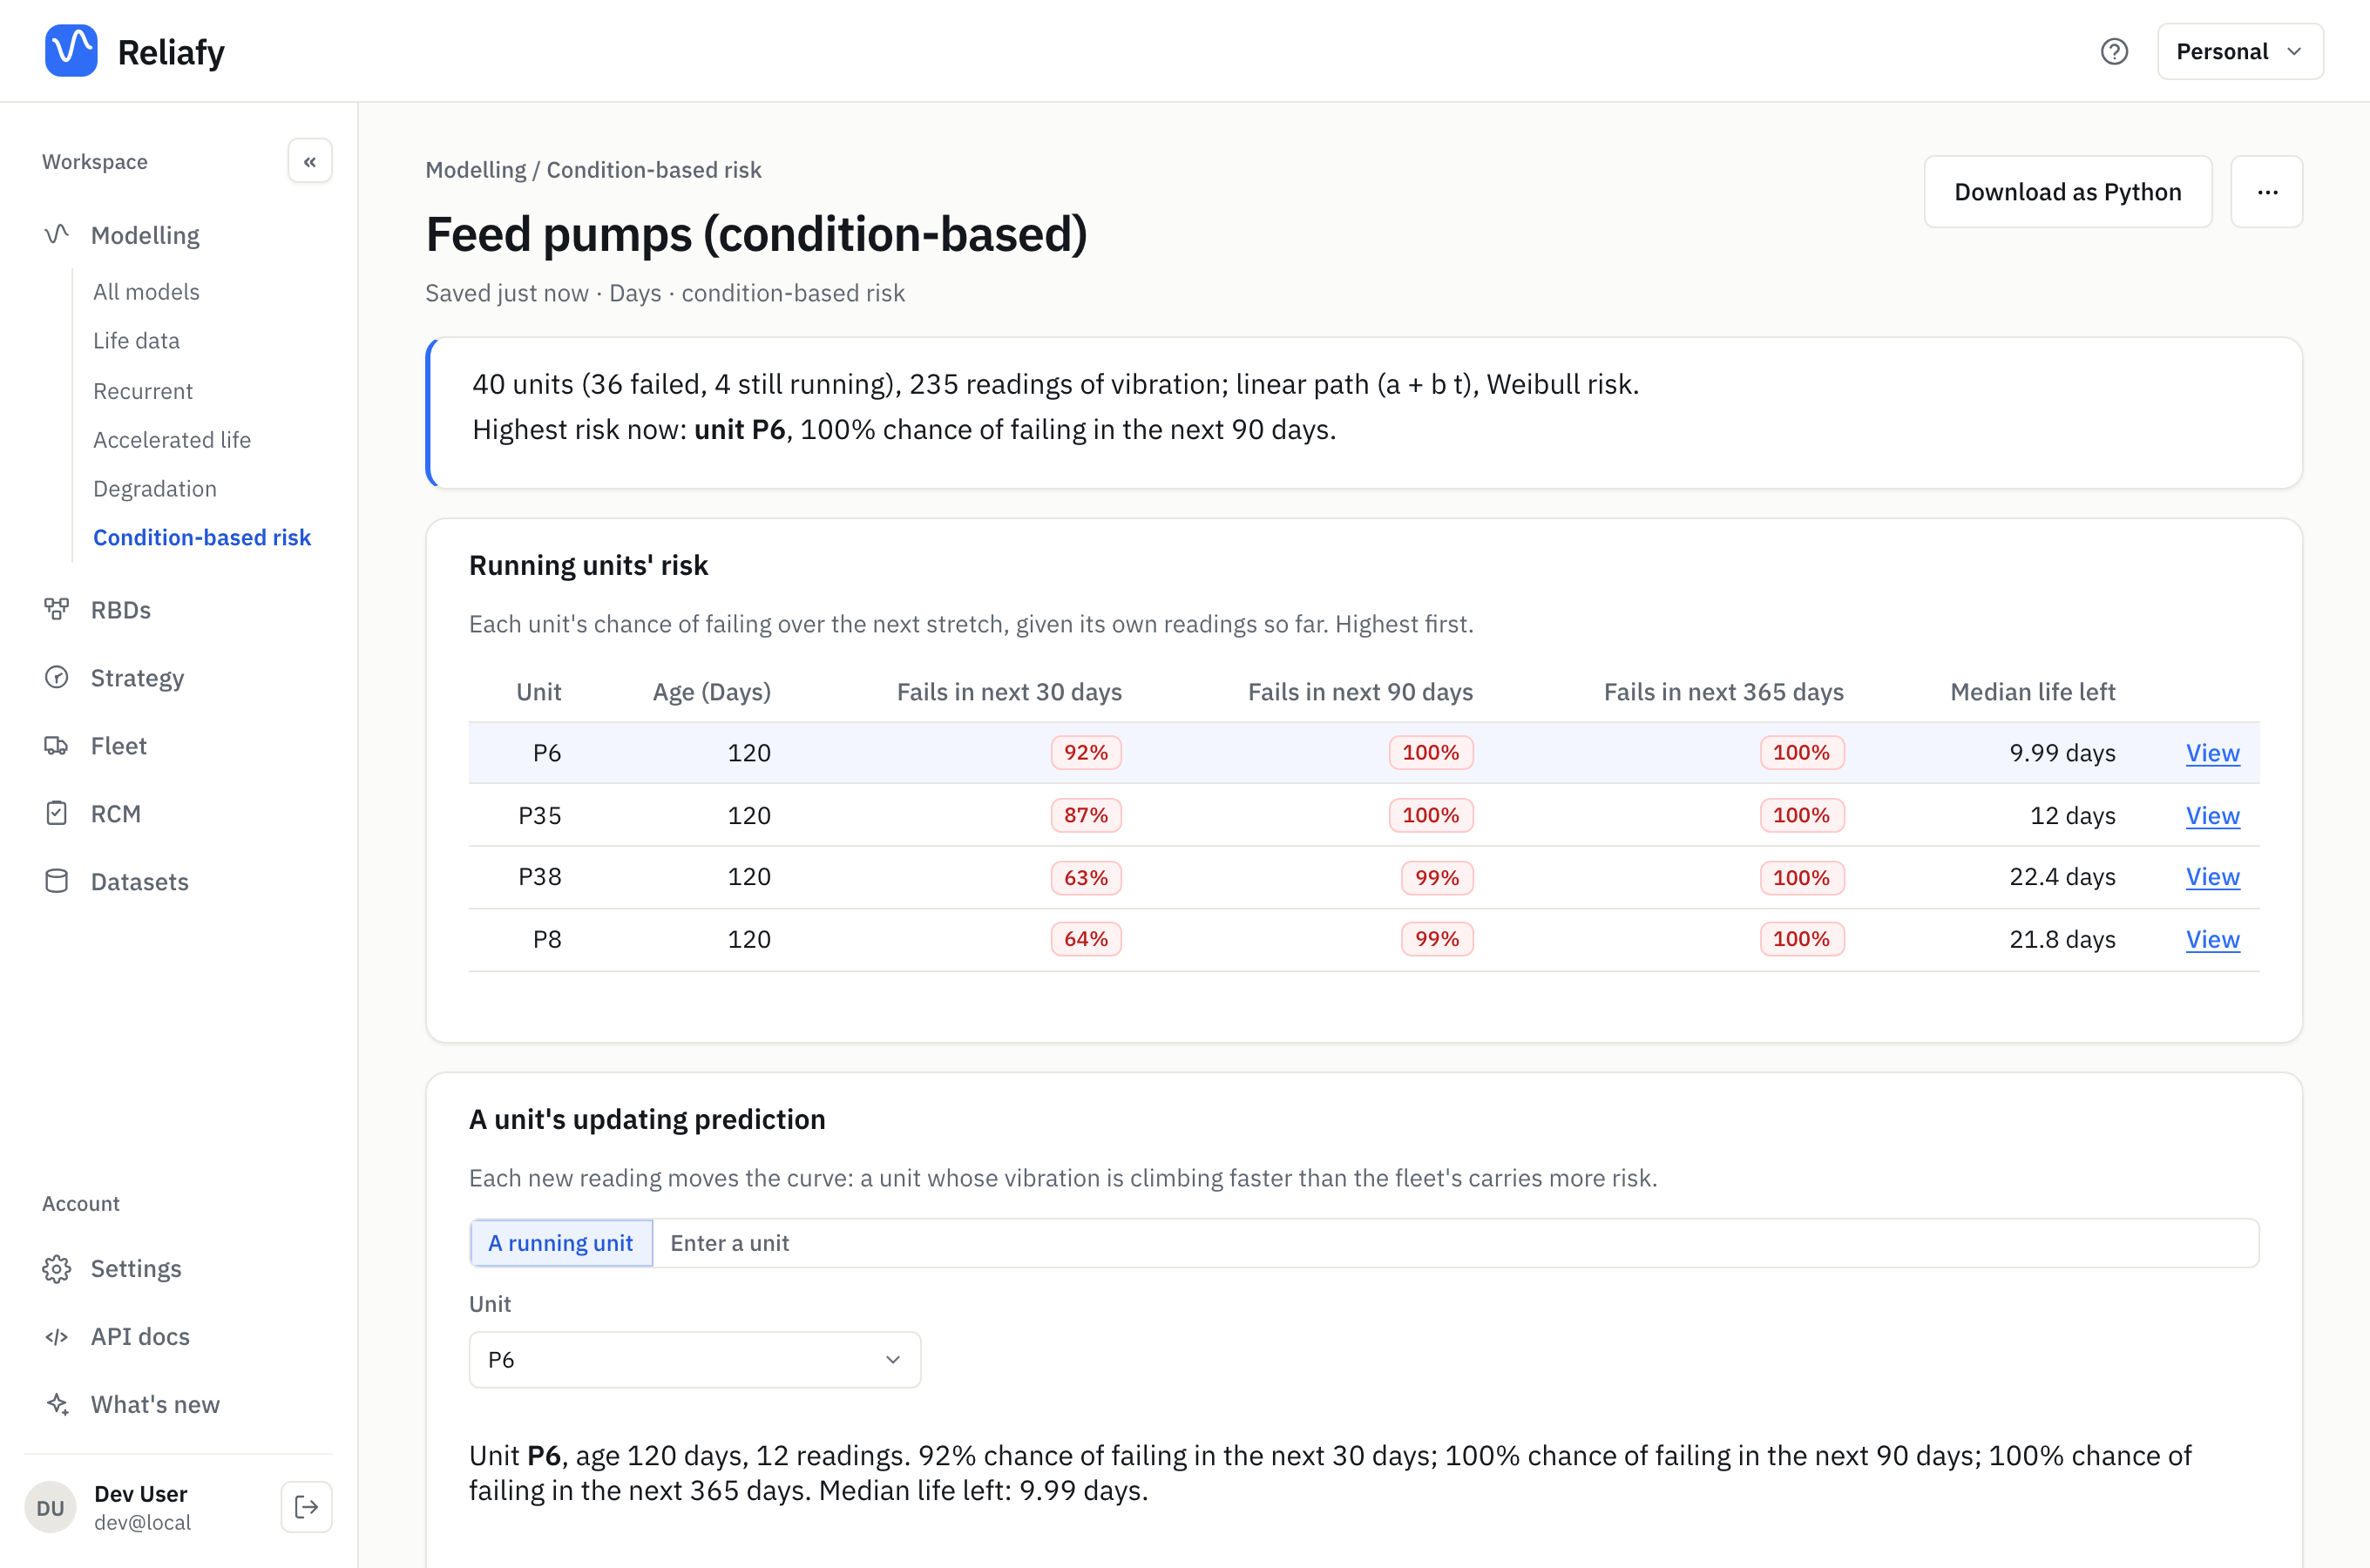
The colours are a quick read: red at 50% or more, amber from 10%. The demo fleet of 40 pumps in this guide has four still running, and pump P6, whose vibration has climbed fastest, has a 92% chance of failing in the next 30 days. That's the one to look at first.
What changes the risk puts the fitted effects in words: each 1 mm/s higher vibration multiplies the failure rate by 2.79. A hazard ratio of 2 doubles the failure rate at any moment; 0.5 halves it. When the interval includes 1, it says the data can't rule out no effect. The Parameters table below has every fitted value with its 95% interval and a line on what it means.
One unit's view
Press View on a row, or choose a unit under A unit's updating prediction. You get two charts:
- Survival from now: the chance it is still running at each age ahead. It starts at 1 at its age now, because it has survived that far.
- Its vibration: its readings, its own path through them, and where that path is heading, with a 95% band.
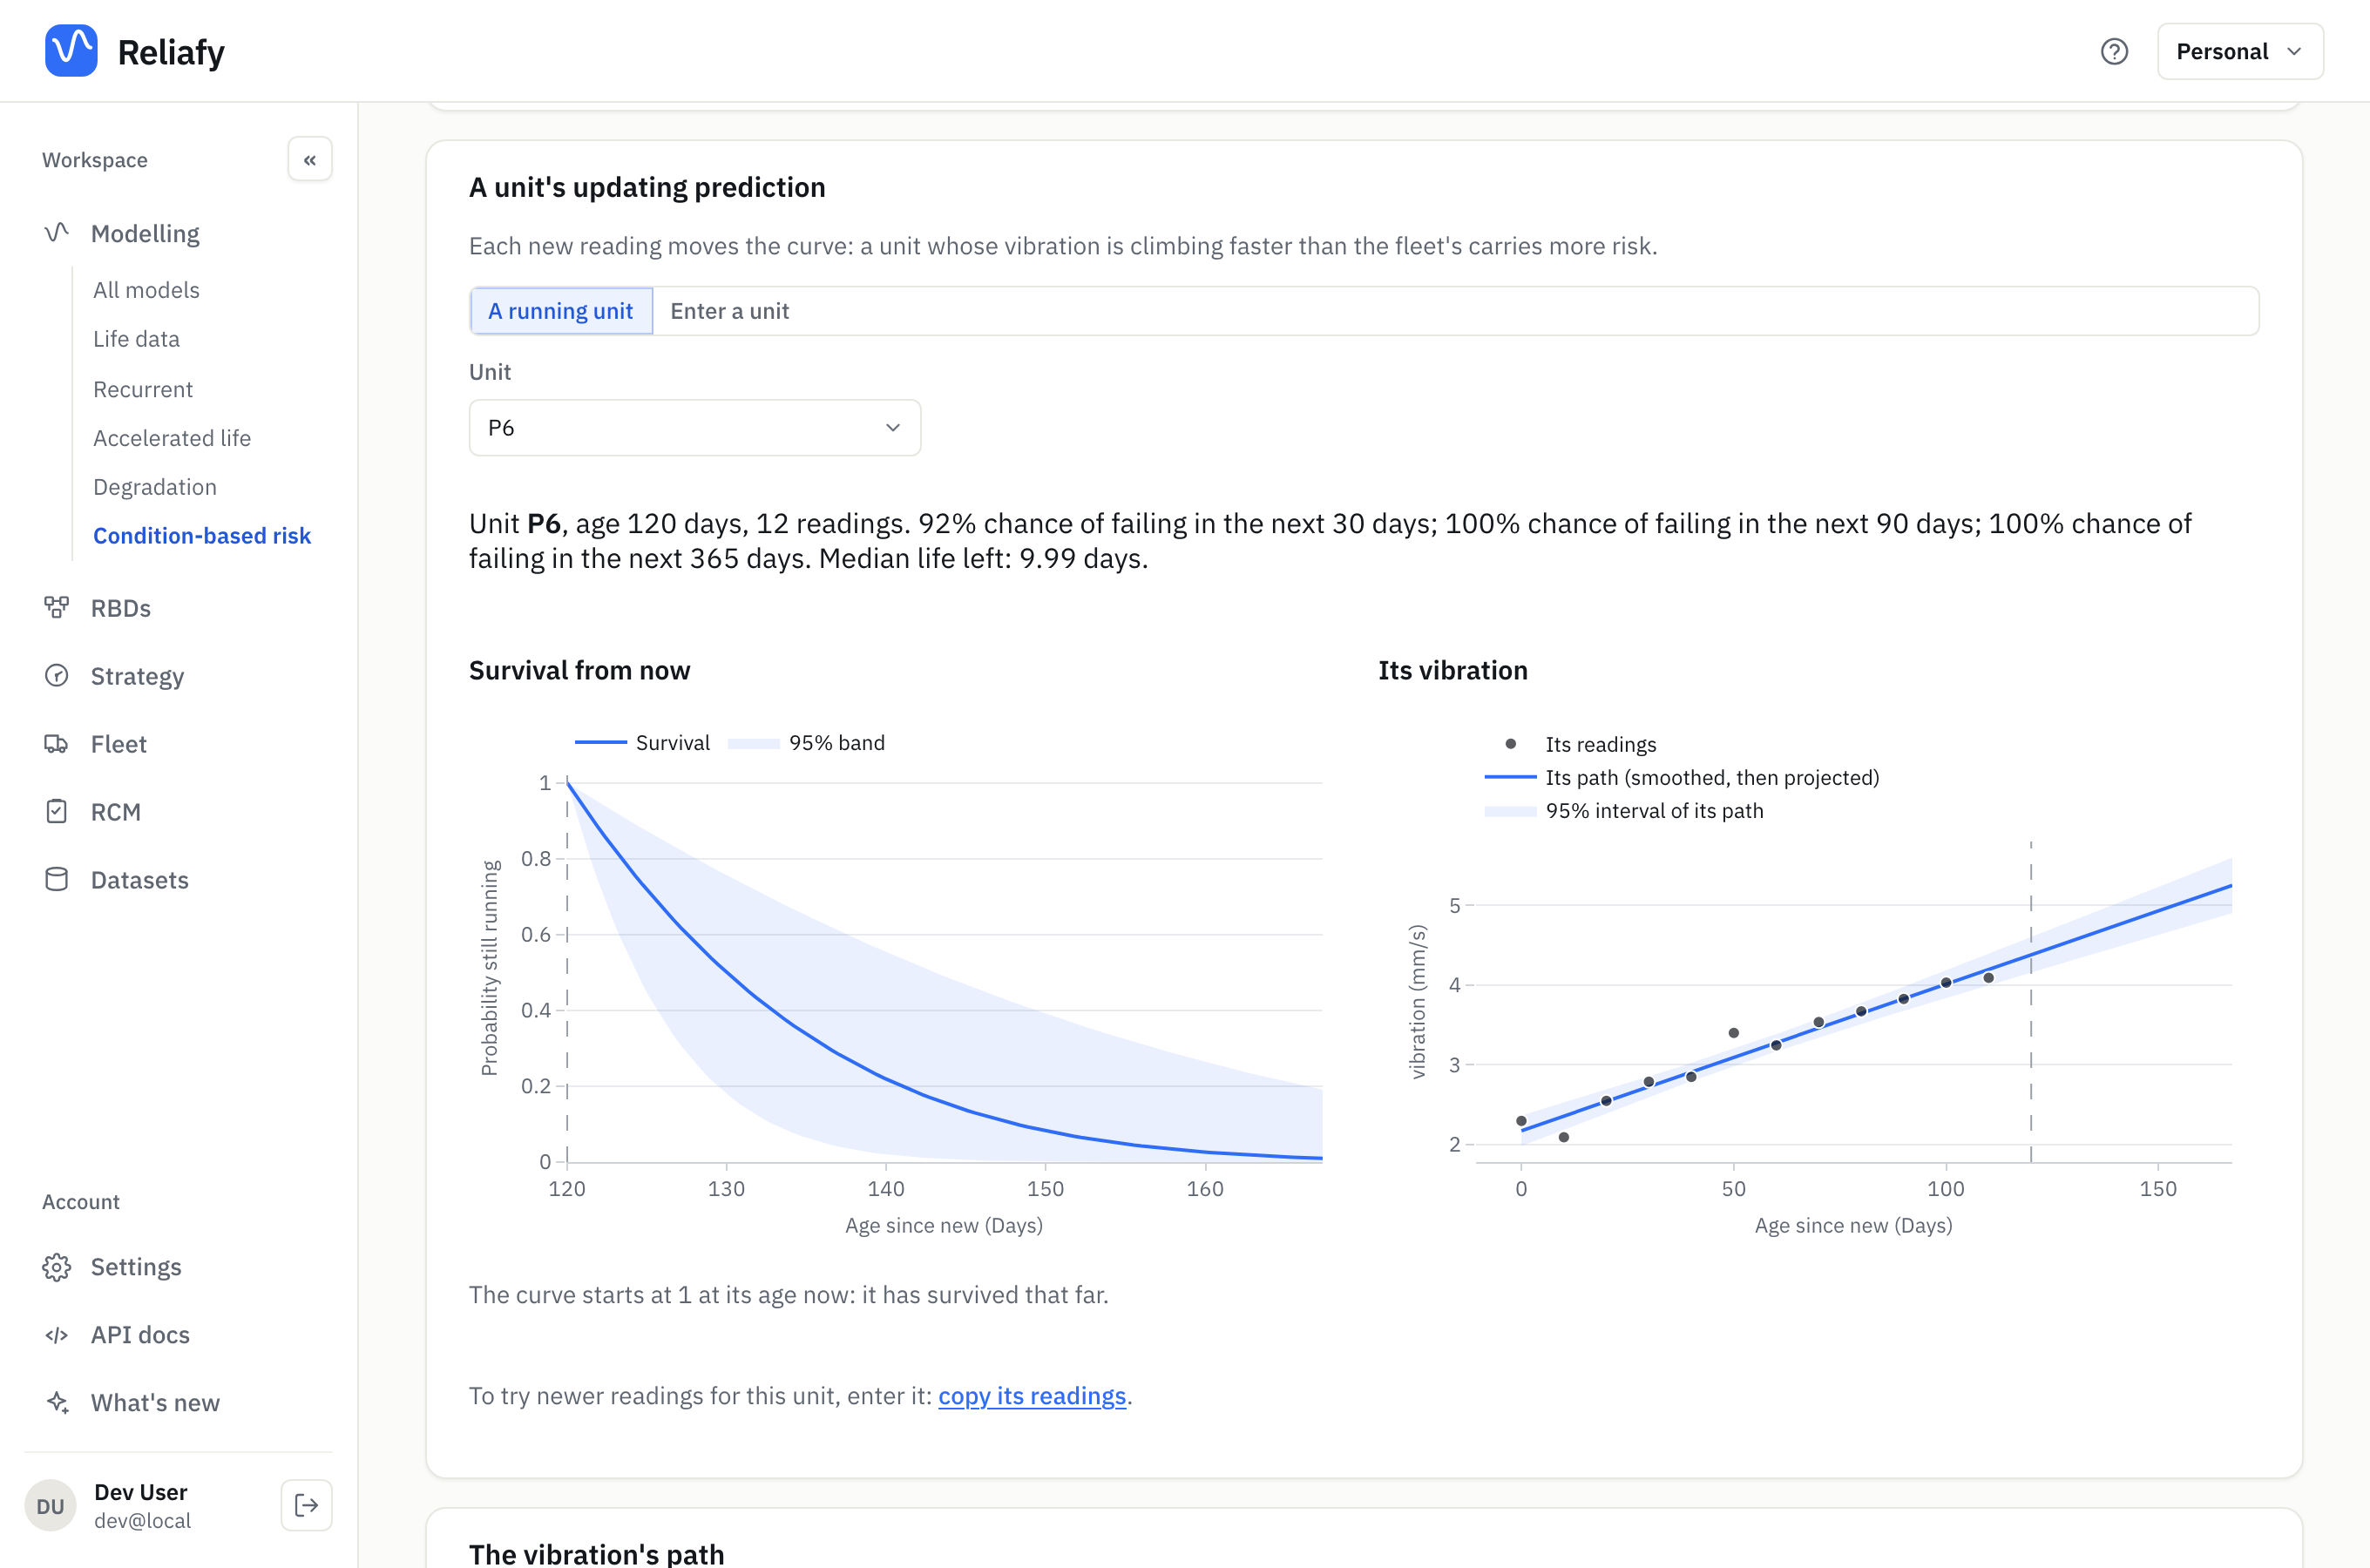
Each new reading moves the answer. To try one before it is in your data, use copy its readings, add the new reading under Enter a unit, and press Predict. Enter a unit also works for a unit that wasn't in the fit at all: give its age now, its covariates and its readings so far.
Use a unit in an RBD
A unit's risk can drive a block in a reliability block diagram, so the system's reliability reflects the condition of the actual units in it. In a non-repairable diagram, open a block, choose Condition-based as its life model, pick the model, and then A running unit (or Enter a unit).
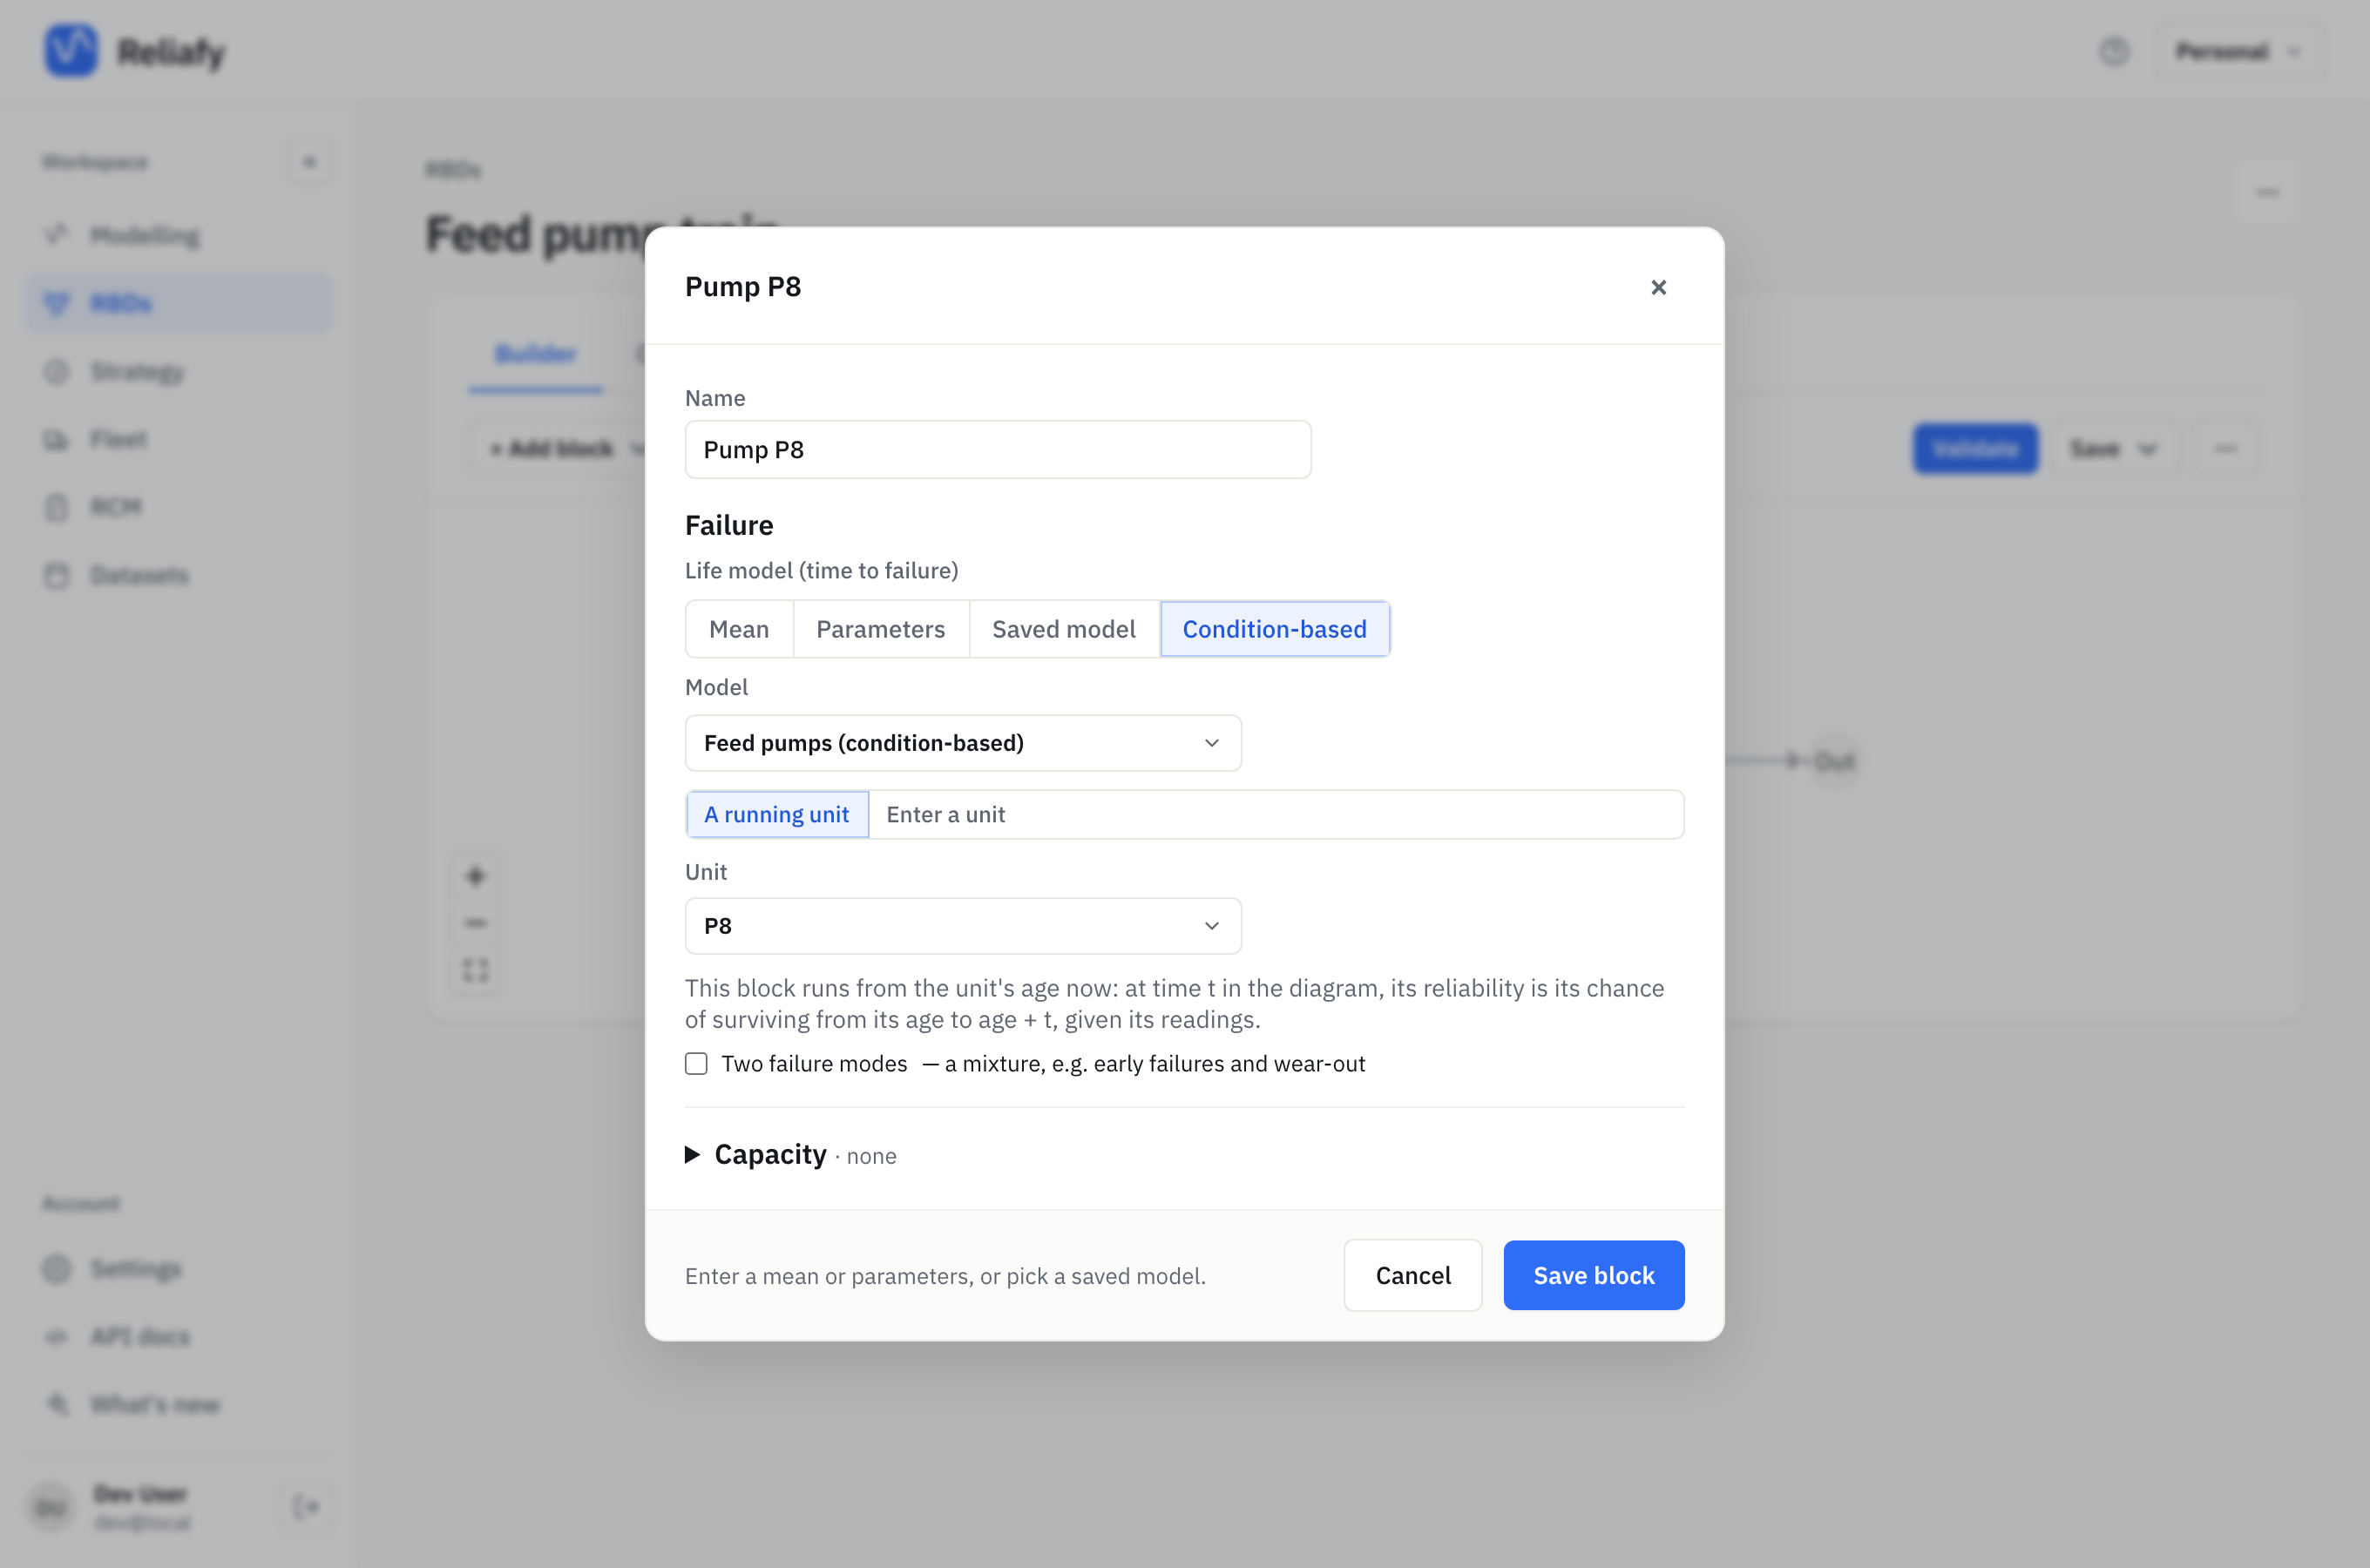
The block's reliability runs from the unit's age now, given its readings, and the results say so: Pump P8 (runs from age 120 days). Two worn pumps in parallel are a weaker pair than two new ones, and the diagram now shows it. See build an RBD for the rest of the diagram.
Limits
- Fitting a model is part of Pro. Opening a saved one, reading its risk table and the unit view are free.
- RBD blocks need a non-repairable diagram. A repairable diagram replaces a failed unit with a new one, which has none of the old unit's readings.
- One reading per model. Vibration or oil debris, not both at once.
- A fit takes up to 2,000 units and 20,000 readings (600 units for the quadratic path).
- Download as Python gives a script that refits the model with SurPyval from the same data.