Build a reliability block diagram
Before you start: Life models for the components — either saved fits or parameters you can type in.
A life model tells you about one component. A reliability block diagram tells you about the system those components make up — and the answer is frequently not what people expect, because reliability composes in ways intuition handles badly. Ten components in series, each 99% reliable, gives a system that's 90% reliable. Two in parallel, each 90%, gives 99%. An RBD makes those interactions explicit.
The important thing to understand up front: an RBD is about logical dependency, not physical layout. Blocks go in series if both are needed for the system to work, and in parallel if either one is enough. Two pumps sitting side by side in the plant room are in series on the diagram if you need them both, and in parallel if either alone can carry the duty. Draw the logic, not the pipework.
Laying out the diagram
Open RBDs → New diagram. Every diagram runs from an input node to an output node, and the system works whenever there's a complete path between them.
Everything for laying out the diagram is in the one toolbar above the canvas. + Add block at its left adds a component, a junction, a voting node or one of the other block types in the middle of the canvas (a right-click on the canvas offers the same list where you clicked). Drag from one block's handle to another to connect them. Series is a straight chain; parallel is two blocks that both branch from the same predecessor and both feed the same successor.
+ Add block can also do the wiring for you. Select a block first and it offers Add after (in series), which puts the new block between that block and whatever it fed, and Add alongside (in parallel), which gives the new block the same connections and merges the pair through a junction. Select a line of blocks joined one after another and Add alongside the selection bypasses the whole line. Select a connection and Insert on this line splits it. A connection never fails, so there's nothing to put alongside one.
Dragging every link gets tedious once a diagram grows, so there's a shortcut:
select two or more blocks and press C. Blocks are grouped into columns by
position and consecutive columns are wired together — so a block and the two
stacked to its right become a fan-out into a redundant stage, and box-selecting
a whole region wires its stages in one press. Links that already exist are left
alone, so pressing C twice does nothing the second time.
When several branches converge and then fan out again, wiring every branch to every successor gets messy. + Add block → Junction drops in a dot that merges them: everything feeds the junction, and the junction feeds what comes next. A junction is perfectly reliable and changes no number in the results — it only tidies the wiring. (It's the voting node with n = 1, so any one branch is enough.)
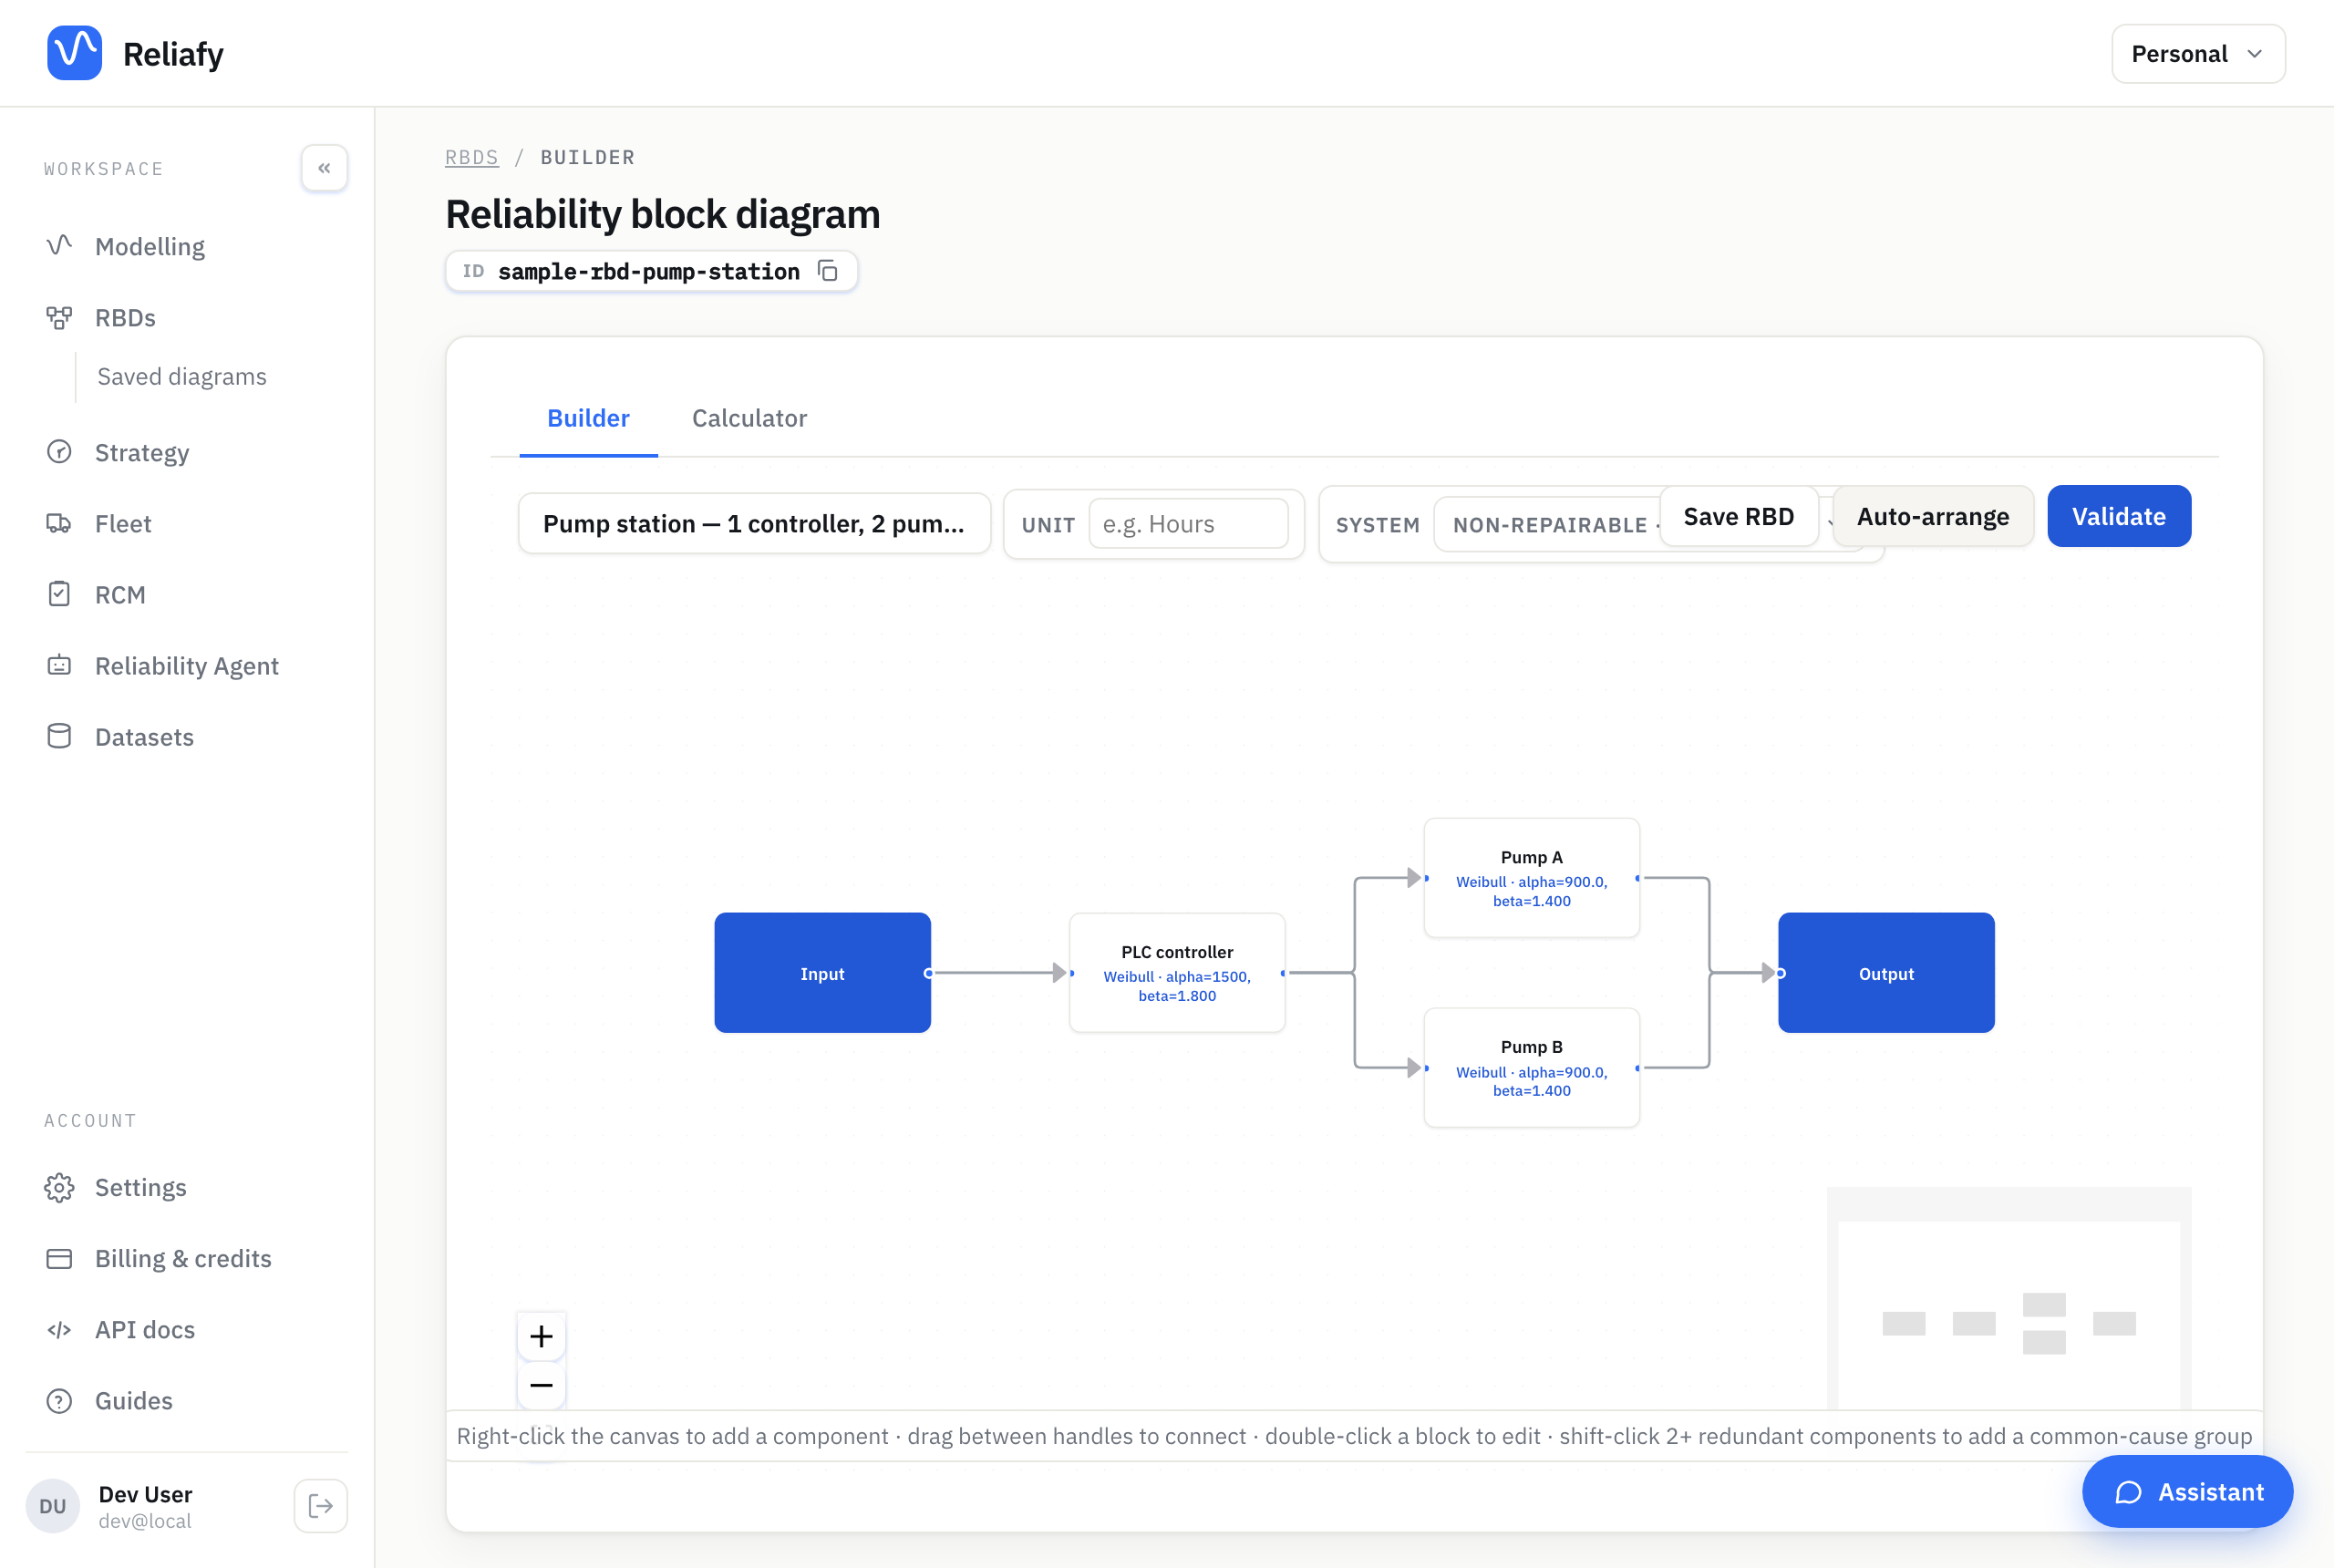
Set the Unit in the toolbar. Everything in the diagram should share one time base, and Reliafy will warn you if you drop in a saved model that was fitted in different units. The menu beside it says what kind of diagram this is: Non-repairable (reliability over time, this guide), Repairable (availability) or Network. The ⋯ menu at the right holds the rest, including Auto-arrange to tidy the layout.
Giving blocks their life models
Double-click a block to open it. Name comes first: call the block what your report will call it (a tag, or "Feed pump A"), because every result names the block by it. To rename without opening the block, double-click its name on the canvas, or select it and press F2.
Then set its life model, as a Mean life, as Parameters or as a Saved model. The two sources are both legitimate:
- A saved model — a fit from your own data. Best when you have it.
- Parameters — type a distribution and its parameters directly. This is how you use a handbook value, a vendor figure, or a researched estimate, and it means you can build a useful diagram before you have failure data for everything in it.
You don't need data for every block to get value out of a diagram. A model built from typical values still tells you where the weak points are.
Beyond series and parallel
Plain series/parallel covers a lot, but real systems need more, and the canvas has block types for the common cases:
- Voting node (MooN) — k-out-of-n voting: the system needs at least k of the n branches feeding the gate. Three sensors where any two must agree is a 2-of-3.
- Standby group — spares that sit dormant (cold) or lightly loaded (hot) until switched in. The risk here is the switching: a cold spare's chance of starting is 1 (a perfect switch-over) until you set it, and 0.95–0.99 is typical for generators and pumps.
- Series (n identical) and Parallel (n identical) — a shorthand for n identical units, so you don't draw twenty identical blocks by hand.
- Sub-system — embeds another saved RBD as a single block, so you can build a diagram of pumping stations where each station is its own diagram.
- Load-sharing — units that split a common load, where survivors get stressed as others fail. Covered in its own guide.
There's also common-cause grouping, for redundant units that can fail together from a shared cause — the correction that stops parallel redundancy from flattering you. That has its own guide, and it's worth reading if you're relying on redundancy for anything that matters.
Validate before you calculate
Press Validate at the right of the toolbar. This is a genuine structural check, not a formality: it will tell you if the diagram has a loop, if blocks aren't wired to anything, if a component is missing its life model, or if a k-of-n setting leaves no path through the system at all. It also tells you whether the diagram can be solved in closed form or needs simulation. Once it passes, the button becomes a status (✓ Valid, or the number of problems) that opens the full check, and it turns back into Validate when you change the diagram.
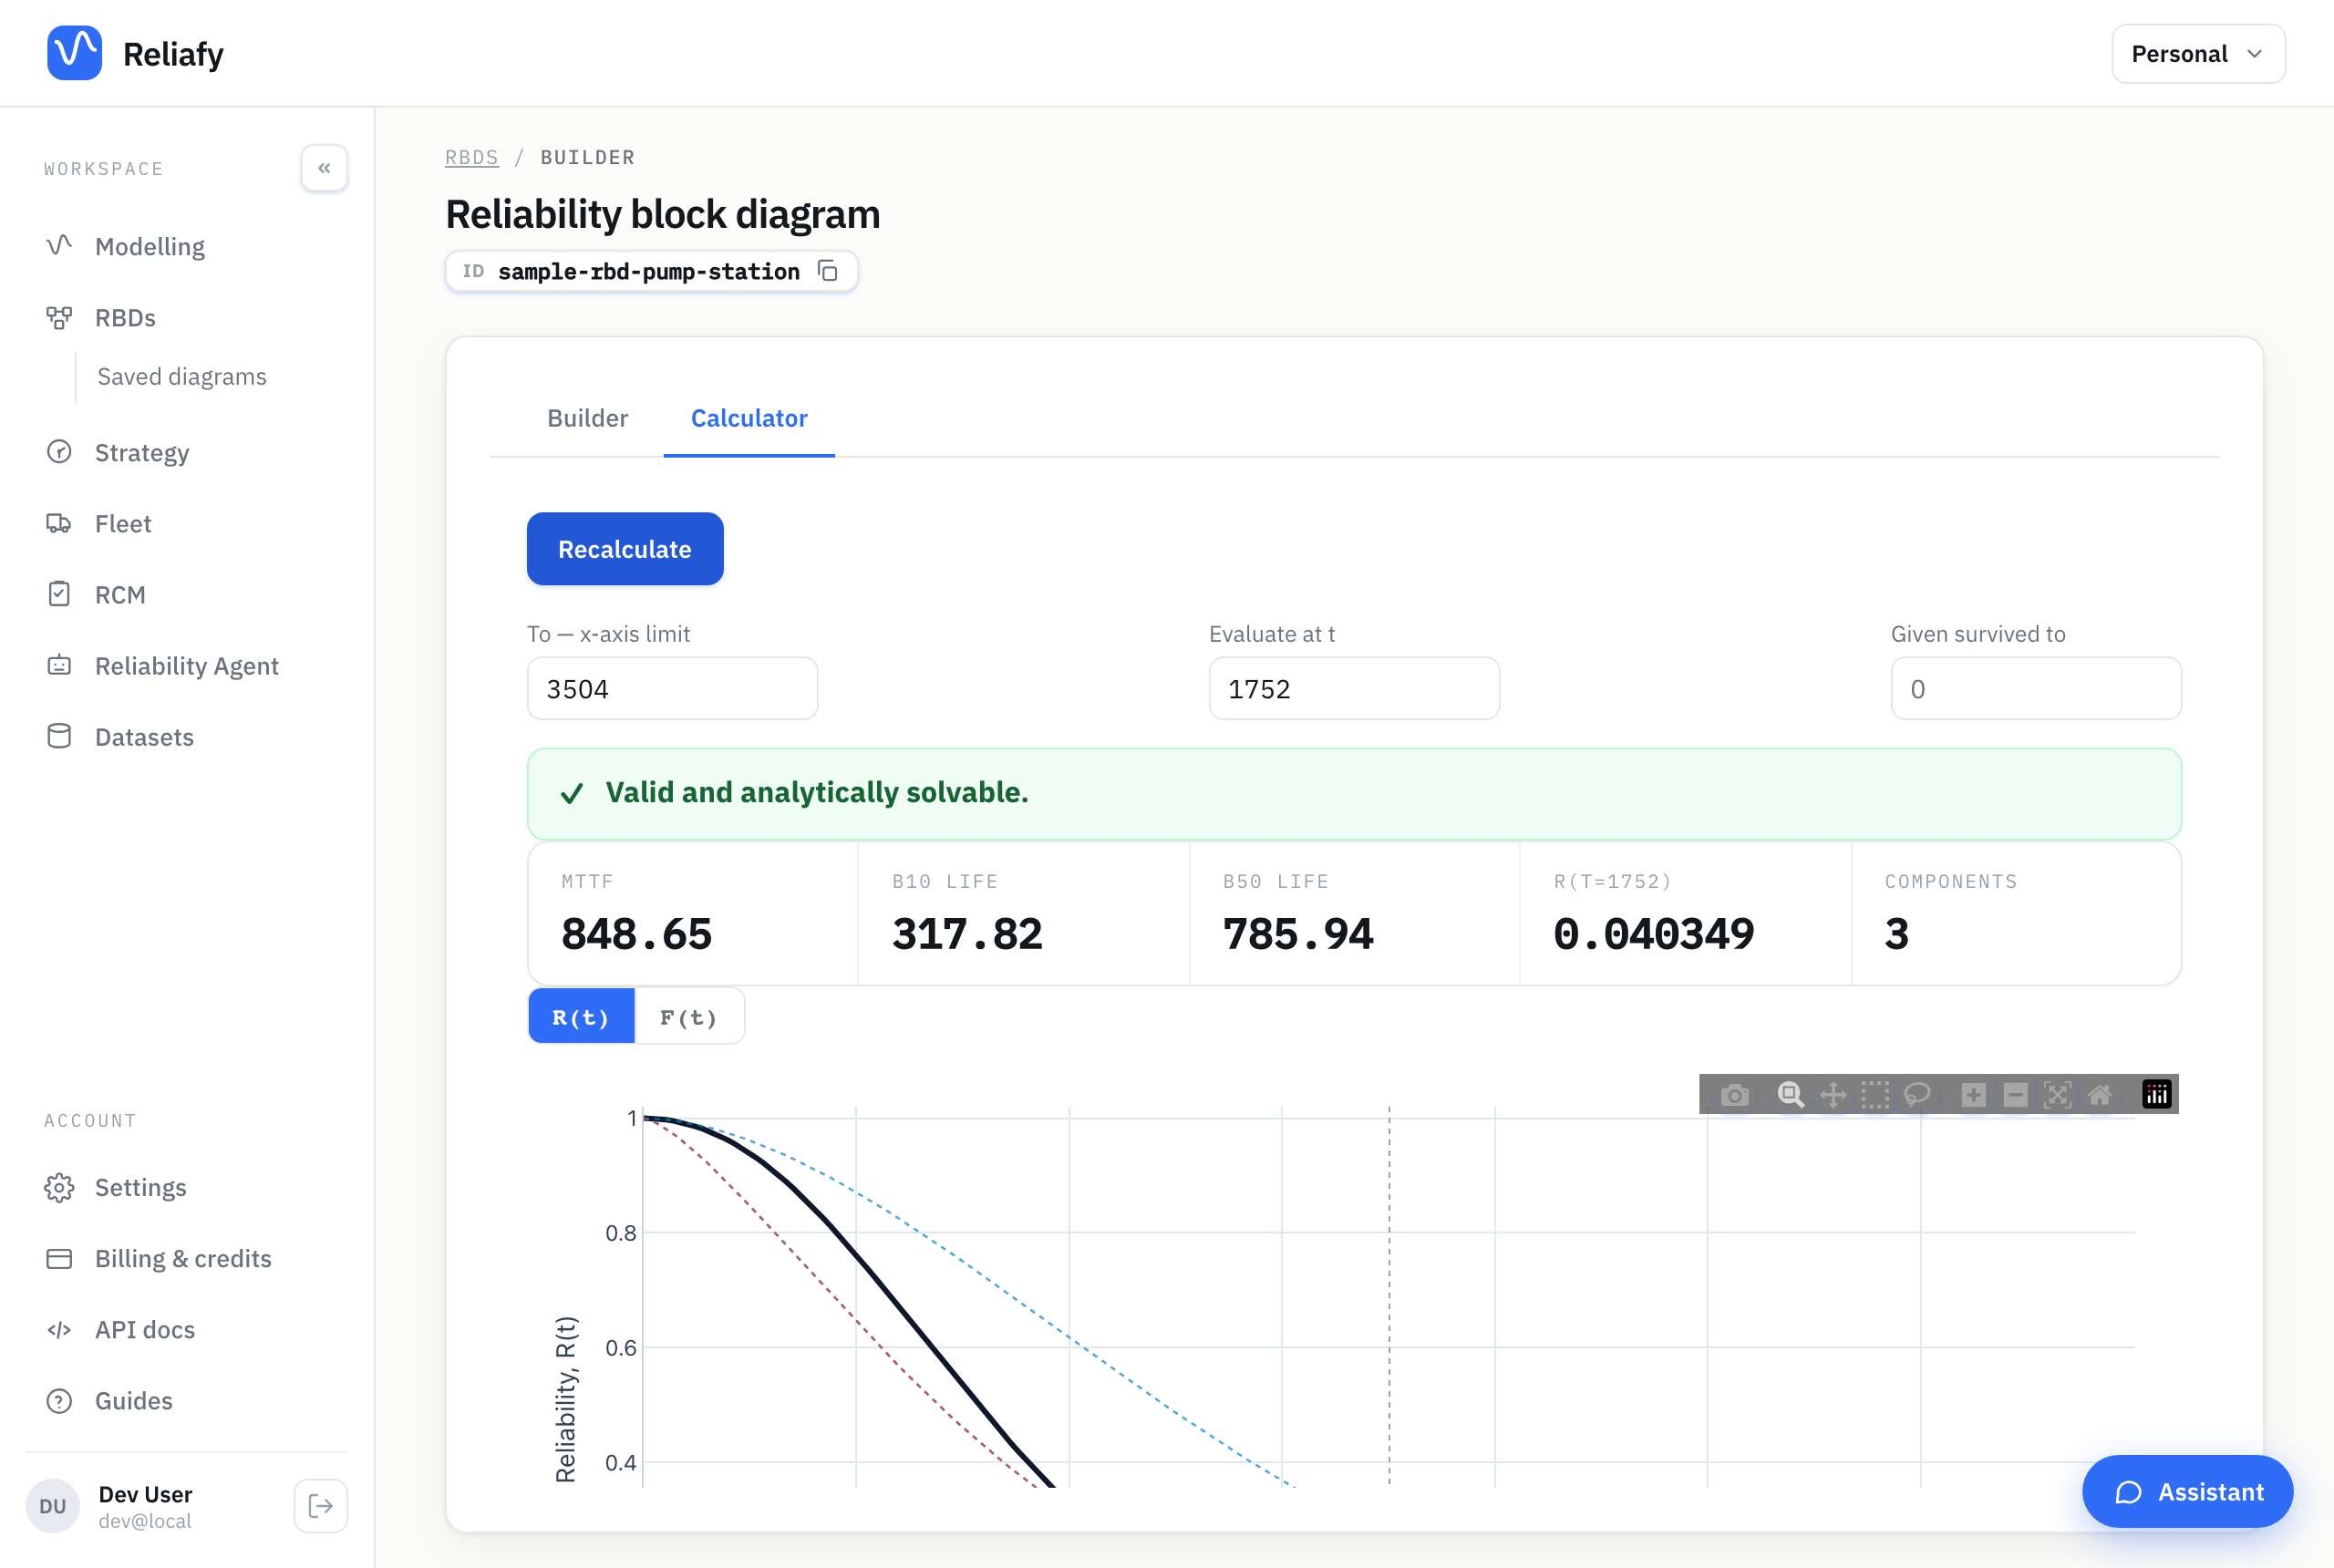
Fix anything it reports, then switch to the Calculator tab and press Calculate. For the sample pump station (a controller in series with two redundant pumps) the MTTF is 849 hours and the B10 life 318 hours.
Reading the results
You get the system reliability curve over time, the MTTF, and system B-lives (B10 is the time by which 10% of systems have failed) — the same quantities you'd get from a single fitted model, but for the whole assembly.
Two things are worth more attention than they usually get:
Importance measures rank the components by how much each one actually matters to system reliability. This is not the same as which component is least reliable — a weak component behind good redundancy may matter far less than a mediocre one sitting alone in series. Importance tells you where an improvement would actually move the system, which is the question you're usually trying to answer.
Minimal cut sets are the smallest groups of components whose combined failure takes the system down. A cut set of size one is a single point of failure, and seeing them listed explicitly is often the most immediately useful output of the whole exercise.
The other tabs ask other questions of the same diagram: Fault tree draws it as a fault tree, Design works out how many copies of each block give the most reliability within a budget or reach a target at the least cost, Targets sets a reliability target for the whole system and works out what each block needs to meet it, and Outage history checks the diagram against the outages it really had (see checking a diagram against its outage history).
Take it with you: download as Python
Once a diagram is saved, Save → Download as Python in the toolbar gives you a standalone script that rebuilds the same diagram with the open-source SurPyval and RePyability libraries and runs the same calculation on your own machine — reliability, MTTF and importance for a non-repairable diagram, steady-state availability and the availability simulation for a repairable one. It's free on every plan, works for samples and diagrams shared with you, and appears on public links too. Each block is one commented variable, so the script doubles as a readable record of the model for a report, a thesis appendix or a colleague without an account.
Install the two libraries (RePyability goes in with --no-deps, so pip can't
swap in a different SurPyval) and run the file. The script's header
lists the exact commands for the versions Reliafy runs:
pip install "surpyval==0.25"
pip install networkx tqdm
pip install --no-deps "git+https://github.com/derrynknife/RePyability.git@v0.15"
python my_diagram.py
The script downloads the last saved version of the diagram. A block the script can't rebuild on its own — one using a fitted proportional-hazards, non-parametric or load-sharing model — is left as a clearly marked placeholder that stops with an explanation until you set its parameters.
To change the diagram in code, RePyability's guide to building an RBD covers its structure, and the rest of its documentation every analysis it runs.
Where to go next
If your system is repaired and returned to service rather than replaced, build it as a repairable diagram instead and you'll get uptime rather than a survival curve — see modelling system availability.
If the diagram is a safety instrumented function, switch on Safety function in the toolbar and the results lead with the PFDavg and the SIL instead — see verifying a safety function.
If the diagram already exists in another tool, you don't have to redraw it: import it from BlockSim, Open-PSA, Galileo or an Excel workbook. For a network, where the question is whether two points stay connected, see modelling a network.
You can also build diagrams from Claude or another AI agent: connect it to Reliafy over MCP and it can create, edit and analyse diagrams in your workspace.