Measure production, not just uptime
Before you start: A diagram (repairable for a period's lost output), and what each block can deliver while it works.
Plain availability counts the system as up whenever there is any path from input to output. That is often too generous. A solar farm with one inverter of four down is still exporting, so it counts as up, but it is short of power. A plant with two of three trains running is up, at two-thirds of its rate.
Production availability weighs every partial outage by the output it costs. Give each block a capacity (what it delivers while it works) and set the demand. Reliafy then reports the share of the demand the system delivers and the output lost over a period.
This guide uses a solar farm's export: four 250 kW inverters in parallel feeding one 1,000 kW transformer, against a demand of 900 kW.
Give the blocks a capacity
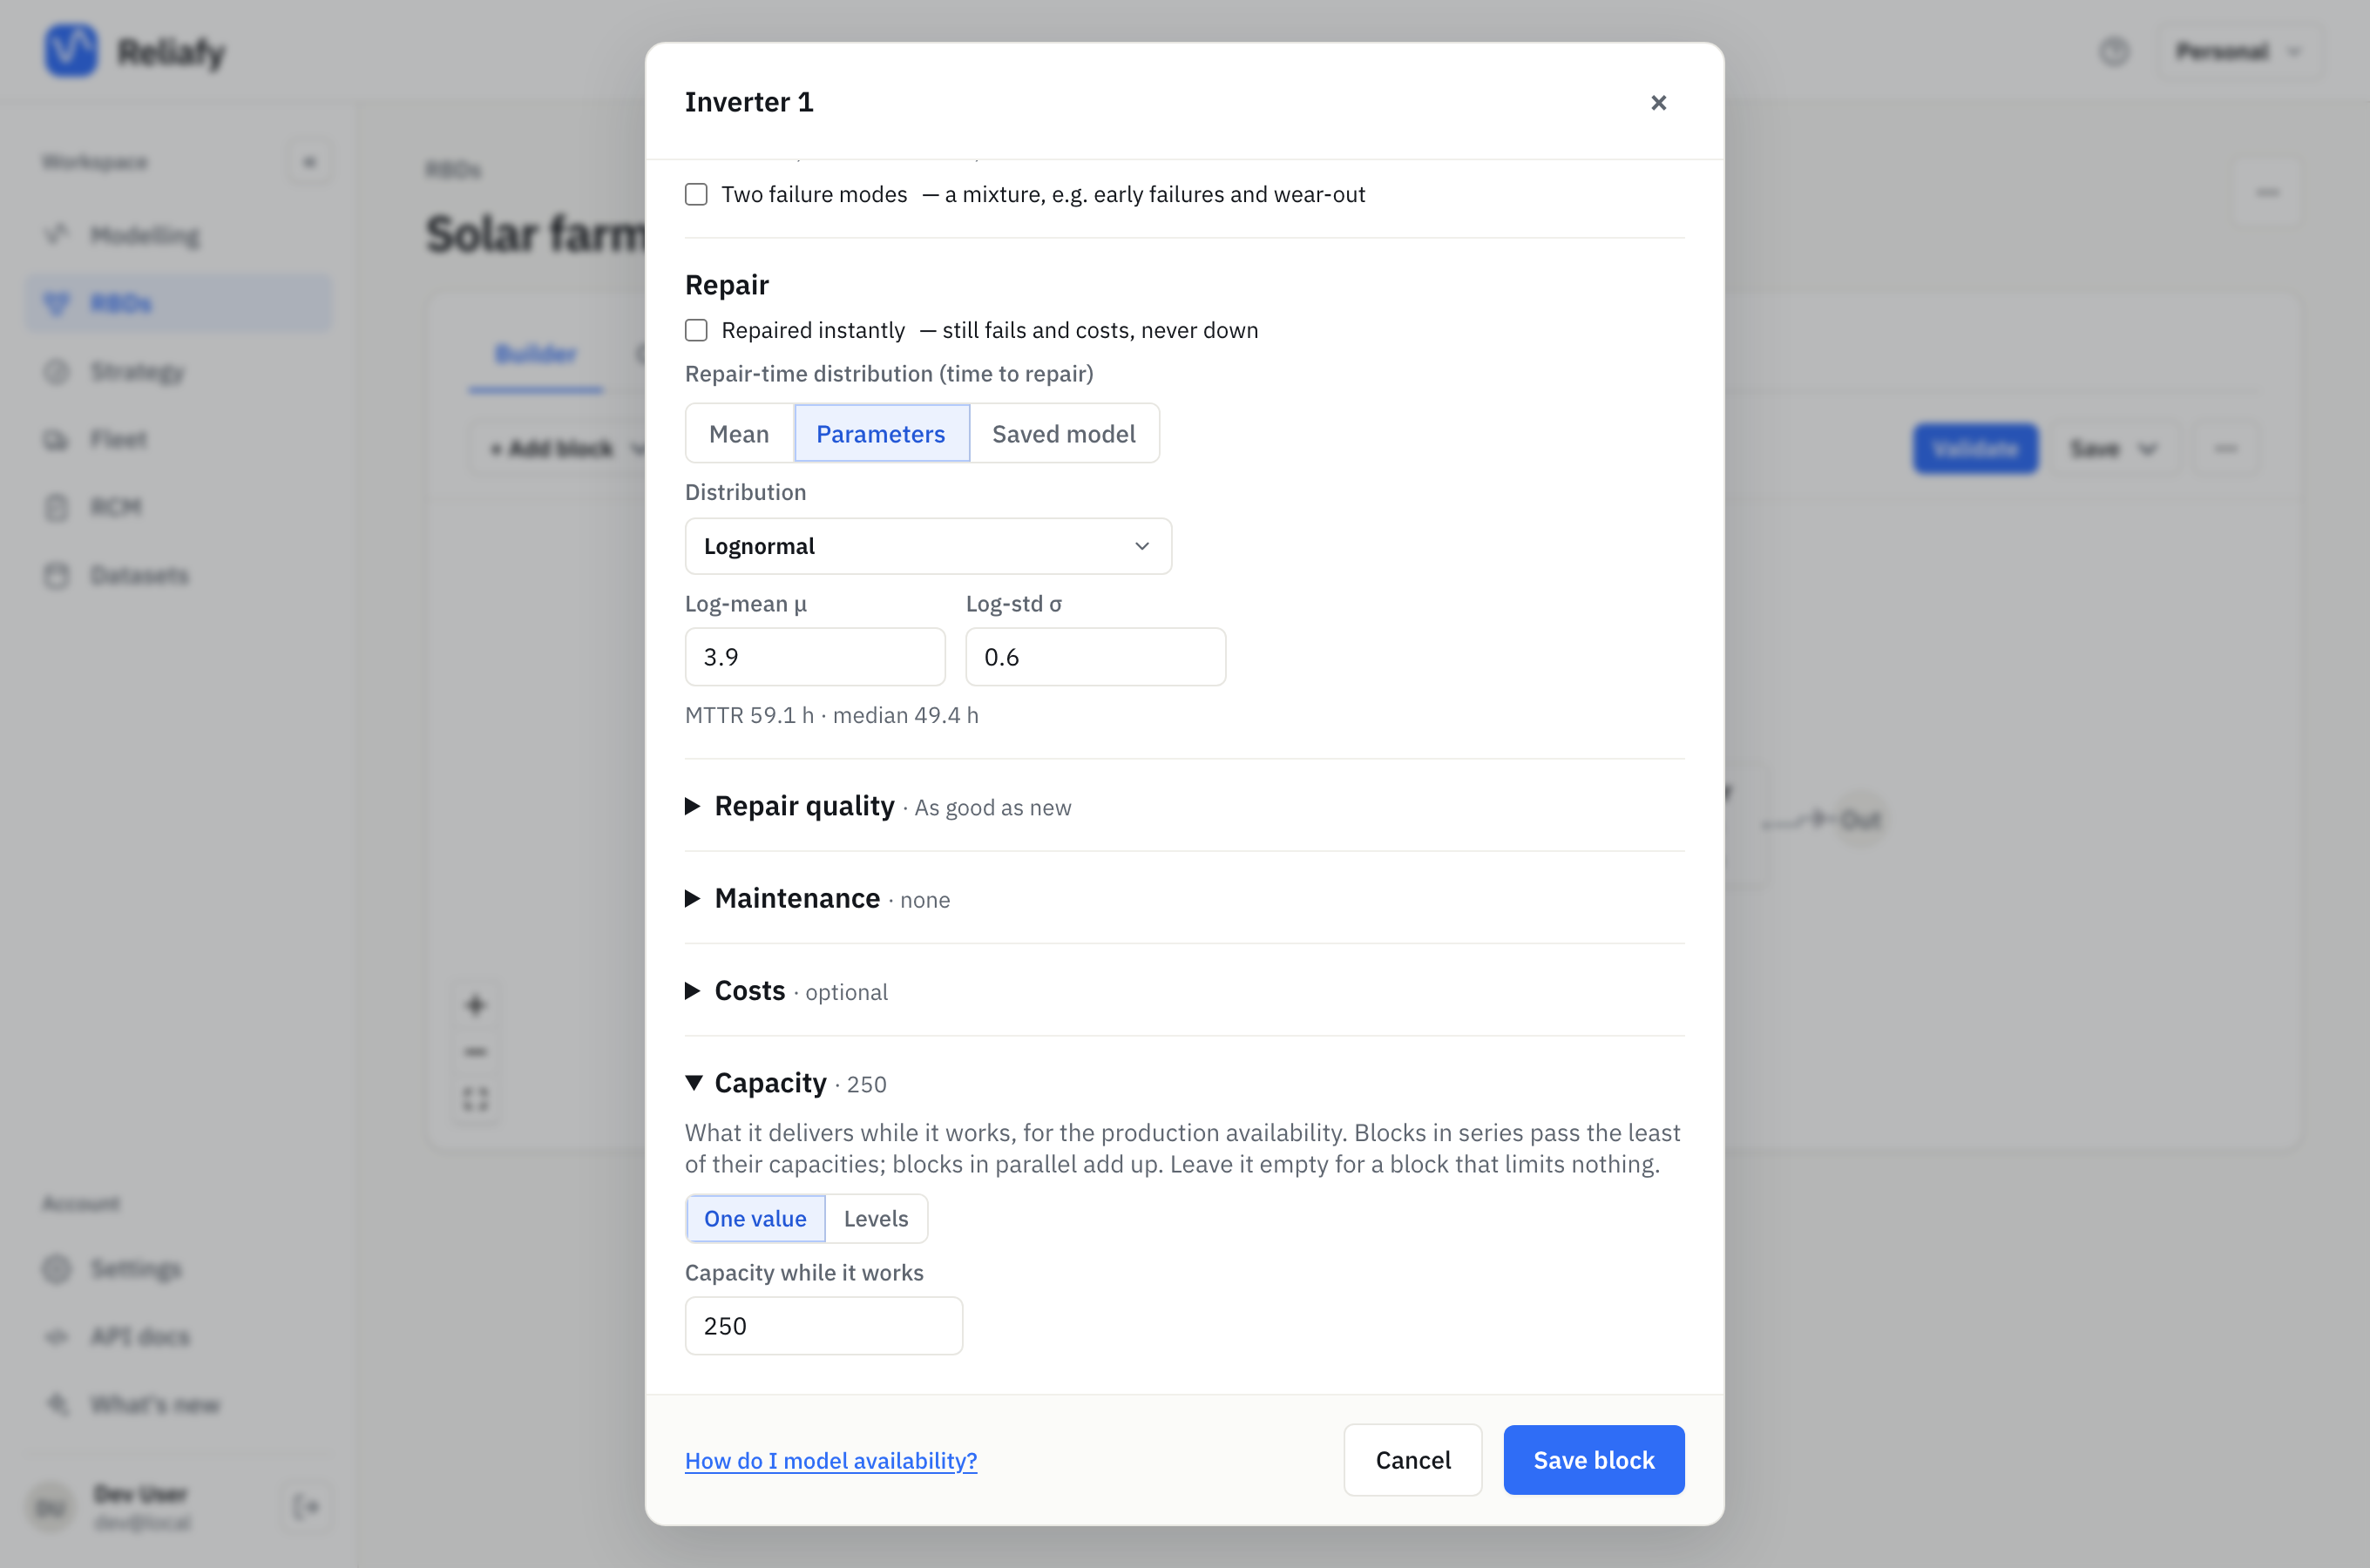
Double-click a block and open its Capacity section. Choose One value and enter the Capacity while it works: 250 for each inverter, 1000 for the transformer. Use the same unit for every block.
Two rules combine the blocks:
- Blocks in series pass the least of their capacities: a 1,000 kW transformer behind 750 kW of inverters delivers 750 kW.
- Blocks in parallel add up: four 250 kW inverters give 1,000 kW.
A block left empty limits nothing. For a block that sometimes runs at reduced output, choose Levels and give each level with its Share of up time (%): 100 for 70% of the time and 60 for the other 30%, say. The shares must add up to 100.
Set the demand and read the result
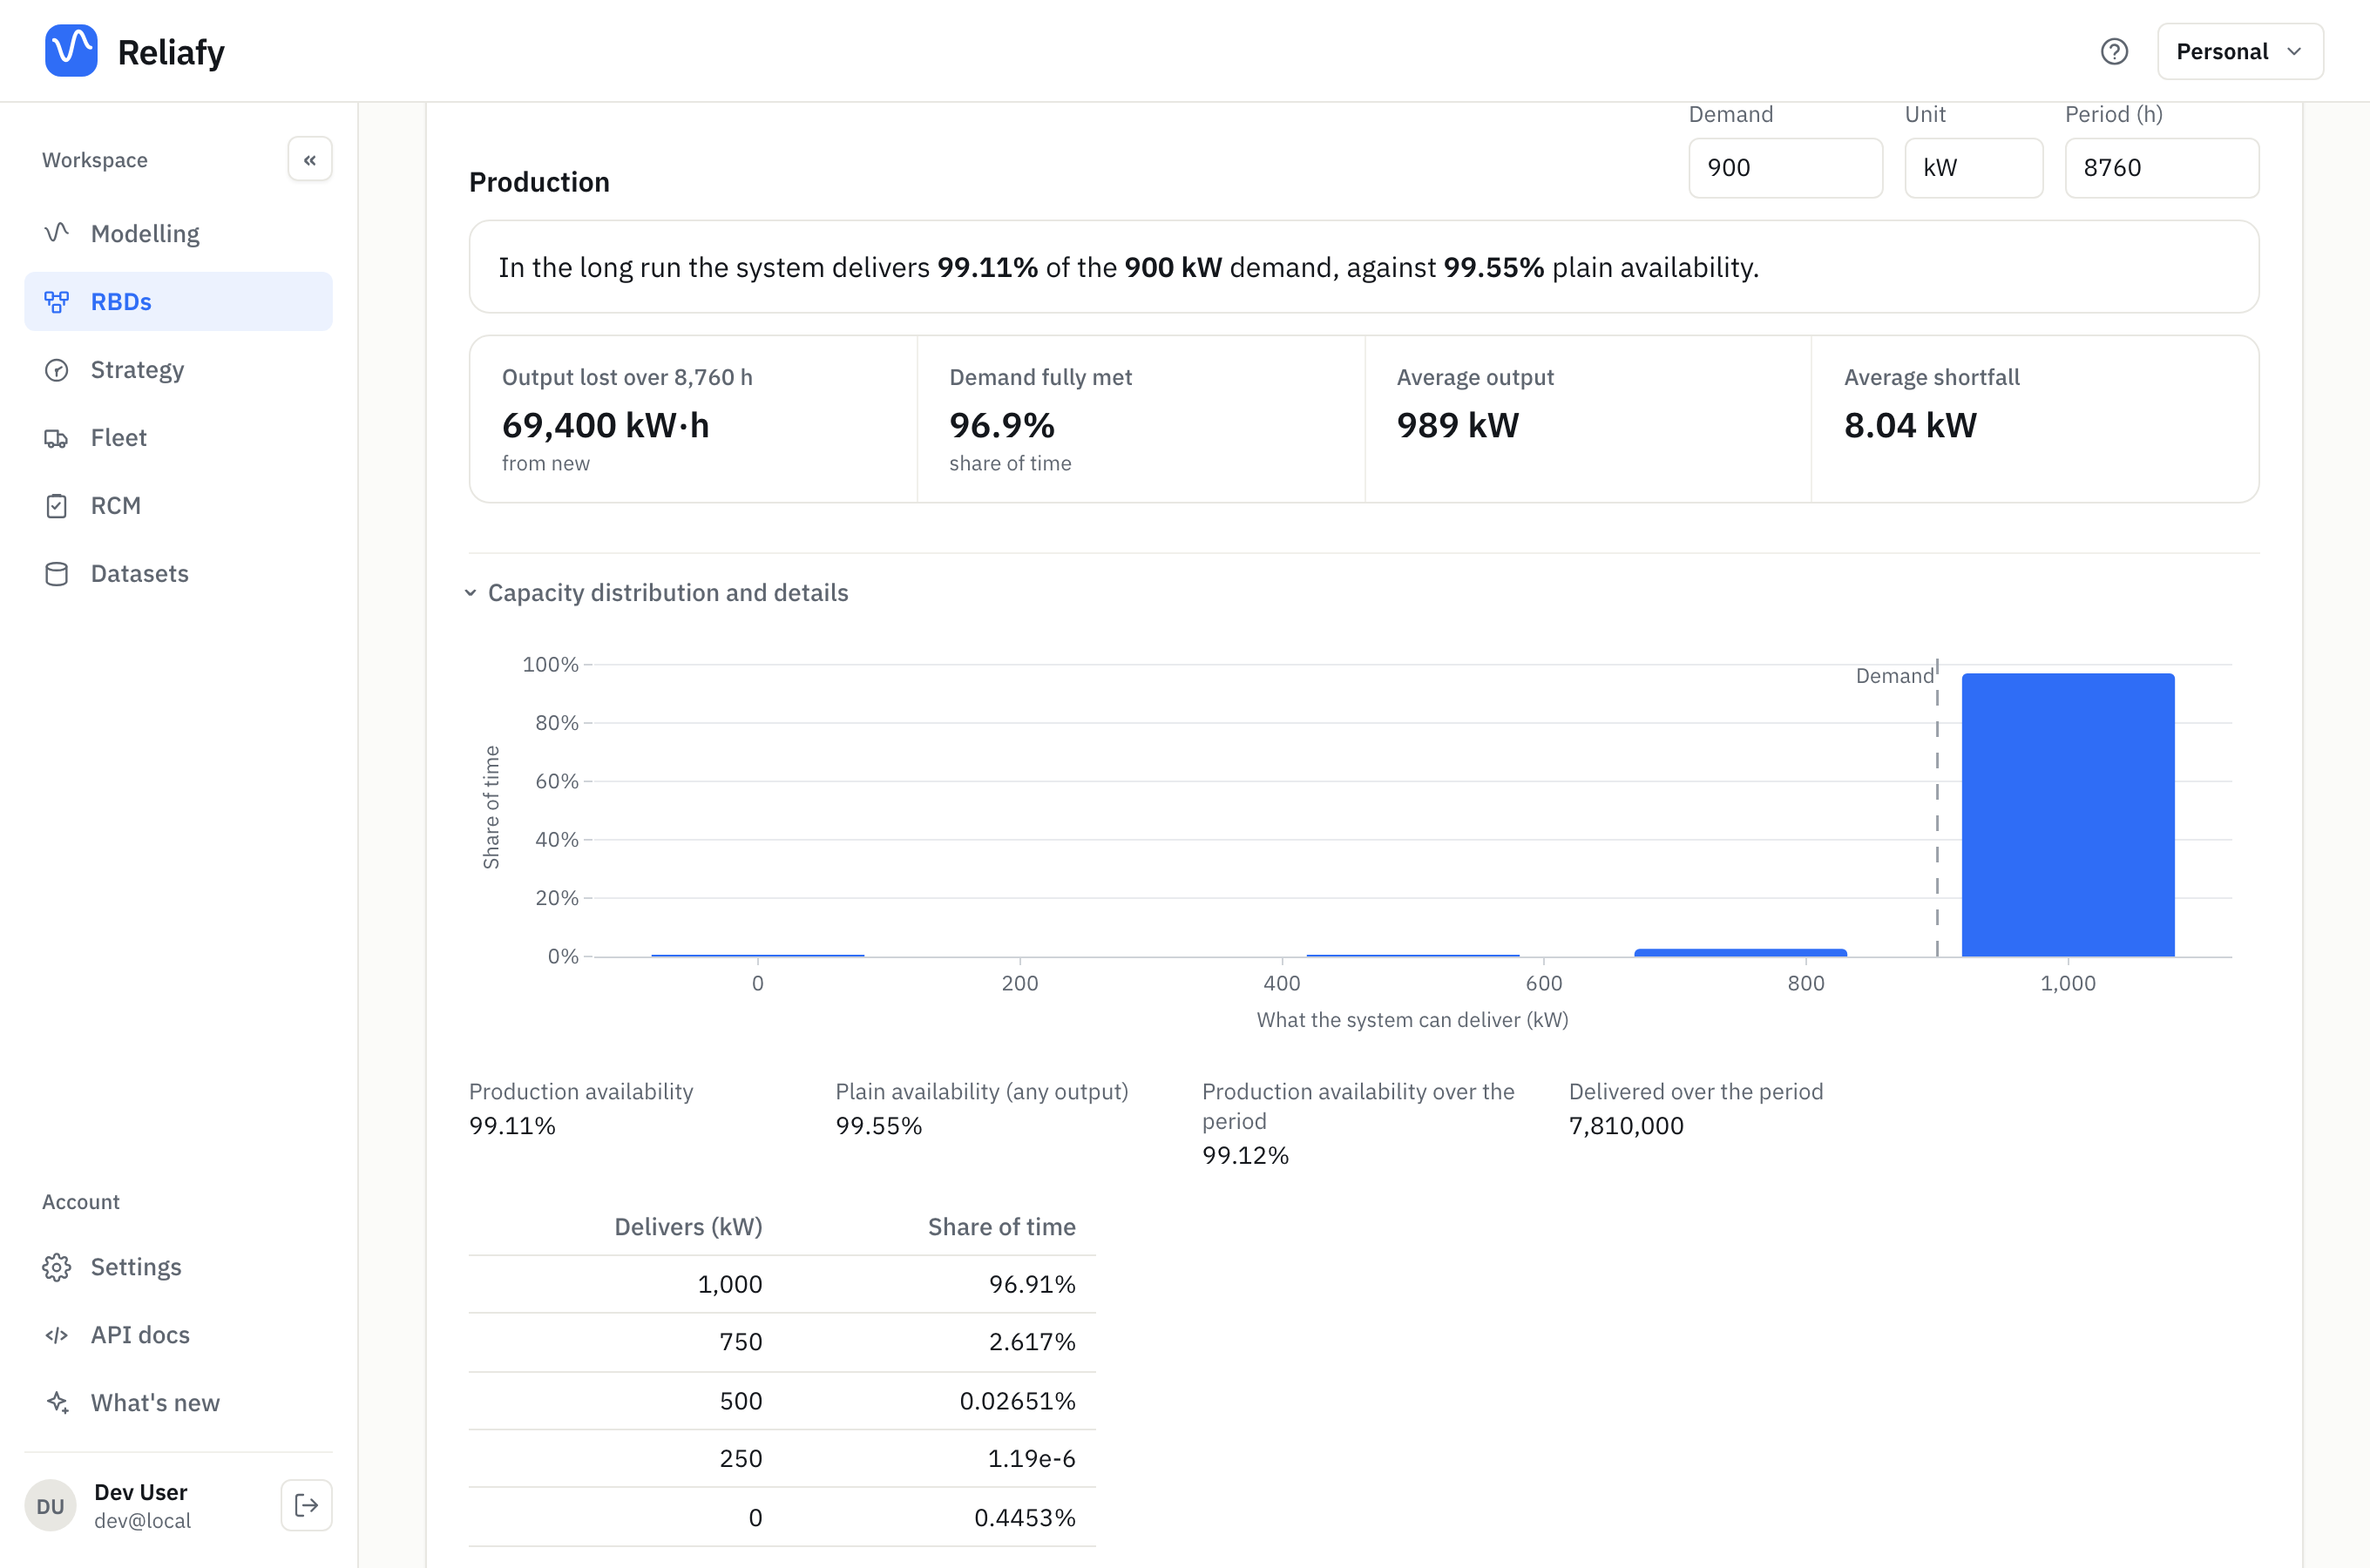
Once any block has a capacity, the Calculator tab gains a Production section under the availability. Enter the Demand, its Unit (kW, t/h, m³/day: any label) and, for a repairable diagram, the Period to total the lost output over. They are saved with the diagram.
For the solar farm:
- In the long run the system delivers 99.11% of the 900 kW demand. Plain availability says 99.55%. The gap is the partial outages.
- Output lost over 8,760 h: about 69,400 kW·h in the first year.
- Demand fully met: 96.9% of the time. The rest of the time at least one inverter, or the transformer, is down.
- Average output is what the system can deliver on average (989 kW), and Average shortfall is the average gap below the demand (8.04 kW).
Capacity distribution and details shows how often the system can deliver each level. Here: all 1,000 kW for 96.91% of the time, 750 kW for 2.617% (one inverter down), and nothing for 0.4453% (the transformer down). The dashed line is the demand: every bar left of it is a shortfall.
The two views rank the blocks differently. Plain availability puts all of the downtime on the transformer, because losing one inverter never stops the farm, so What to improve ranks the inverters last. Production says the inverters cost real output: one down for 2.6% of the time is 150 kW short each time. Use the production figures when output is what you are paid for.
On a non-repairable diagram the section reads the capacity at a time (At time) instead: the chance the demand is fully met then, and the average output.
How it works
Each block is either working, at its capacity, or down, at zero (or at one of its levels). Reliafy combines the blocks exactly, with series taking the least and parallel adding up, to get the distribution of what the whole system can deliver. The production availability is the expected share of the demand delivered:
production availability = E[min(capacity, demand)] ÷ demand
Plain availability is the chance the capacity is above zero.
Where to go next
- Model system availability builds the repairable diagram these figures sit on.
- Costs, intervals and what to improve prices the downtime.