Cost a repairable system and choose its maintenance intervals
Before you start: A repairable diagram with life and repair models on its blocks, and rough costs: repairs, parts, a planned service, an hour of lost production.
Availability says how often a system is down. Money says whether it matters. A repairable diagram can carry the costs that go with each block (repairs, parts, planned work, the price of a spare unit) and the cost of the whole system being down. Reliafy then gives you:
- the running cost and the total cost of ownership, block by block;
- the service and proof-test intervals that cost least, chosen together;
- the change that saves the most, under What to improve.
This guide uses a cooling-water train: a controller, two pumps in parallel and a heat exchanger. The pumps wear out and are replaced every 1,500 hours. Lost production costs 2,000 an hour. Costs are in whatever currency you use.
1. Put the costs and maintenance on the blocks
Double-click a block. A repairable block has these sections:
- Maintenance: None, Scheduled replacement or Hidden failures, proof-tested. Scheduled replacement can be by Age replacement (the clock restarts at a failure), Block replacement (at every multiple of the interval, whatever its age) or Condition-based (inspected, and replaced when the chance of failing before the next inspection is too high). Give how often (Replace every), how long it takes (Takes; blank is instant) and the Cost per replacement. Fill from RCM study… copies a task from an RCM study.
- Costs: Repair cost and Parts cost per failure, Block downtime (a cost while this block is down, even if the system is up) and the Purchase price. A per-failure cost can be a range.
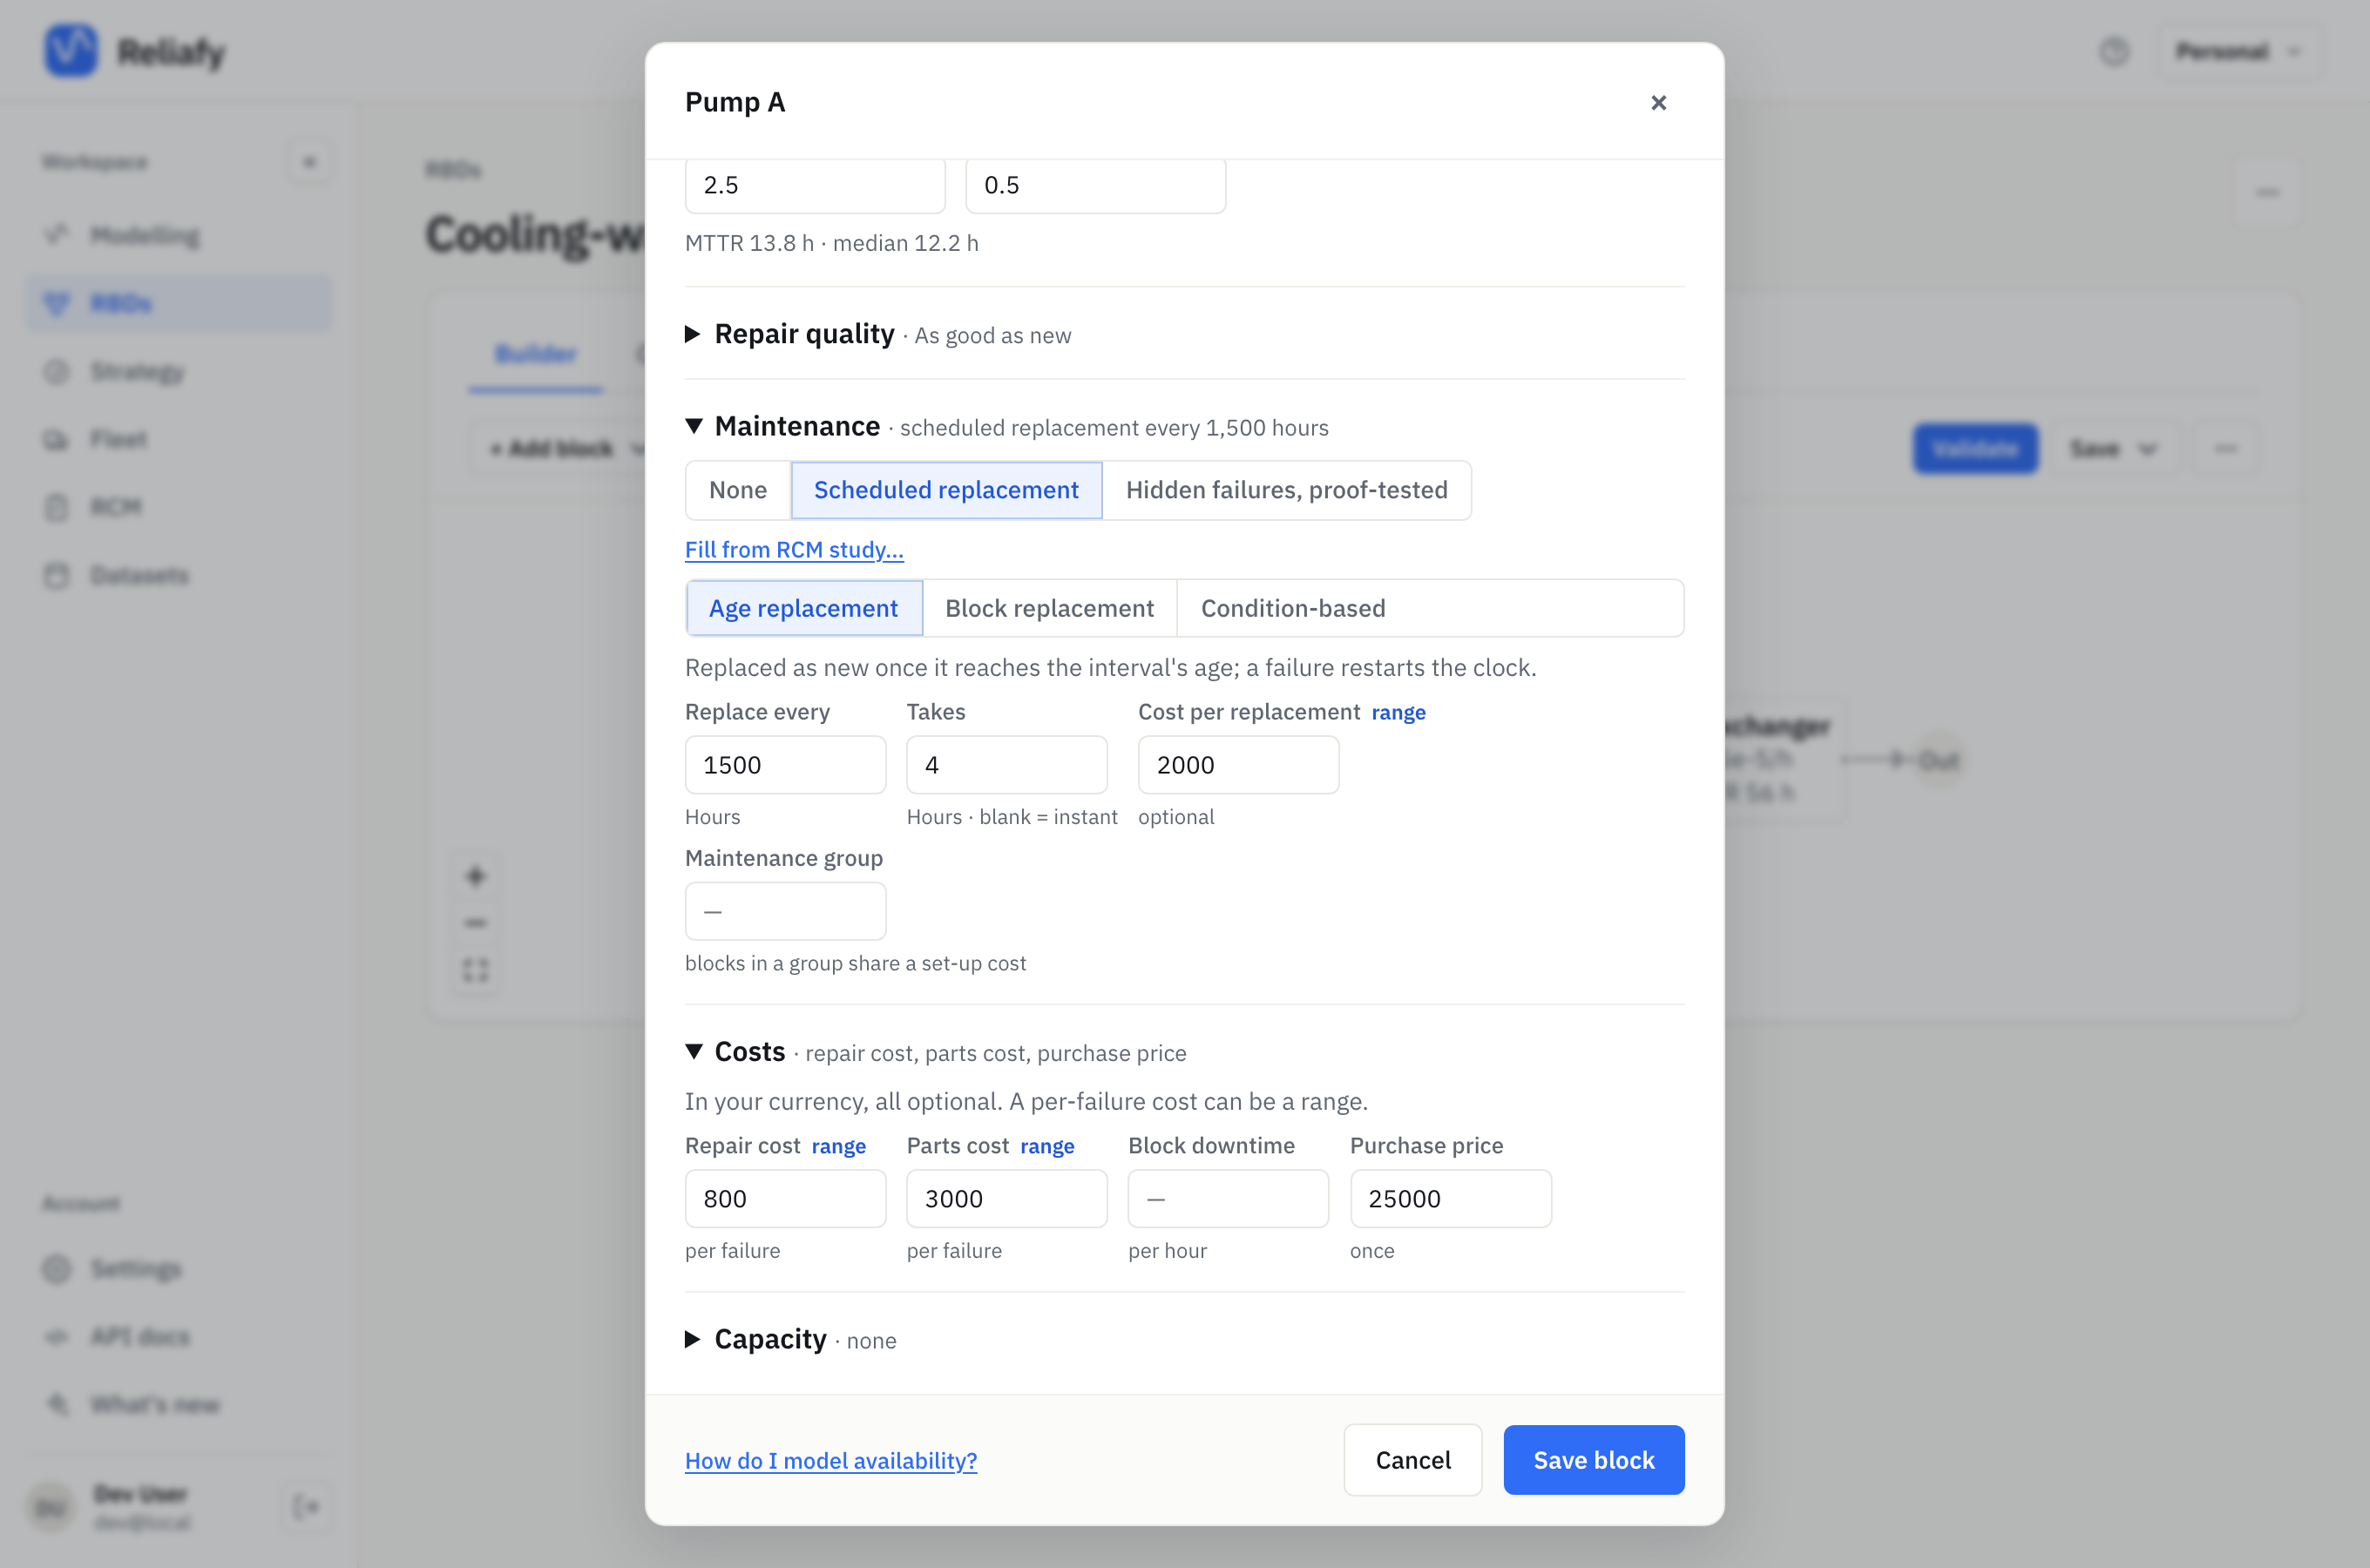
Blocks in the same Maintenance group share a set-up cost (scaffolding, a crane, a shutdown) each time the group stops.
2. Price the downtime
In the ⋯ menu, choose Costs…. Set the System downtime cost per unit of time the whole system is down, the Ownership horizon, and an optional Discount rate (% a year, which needs the diagram in hours, days, weeks, months or years).
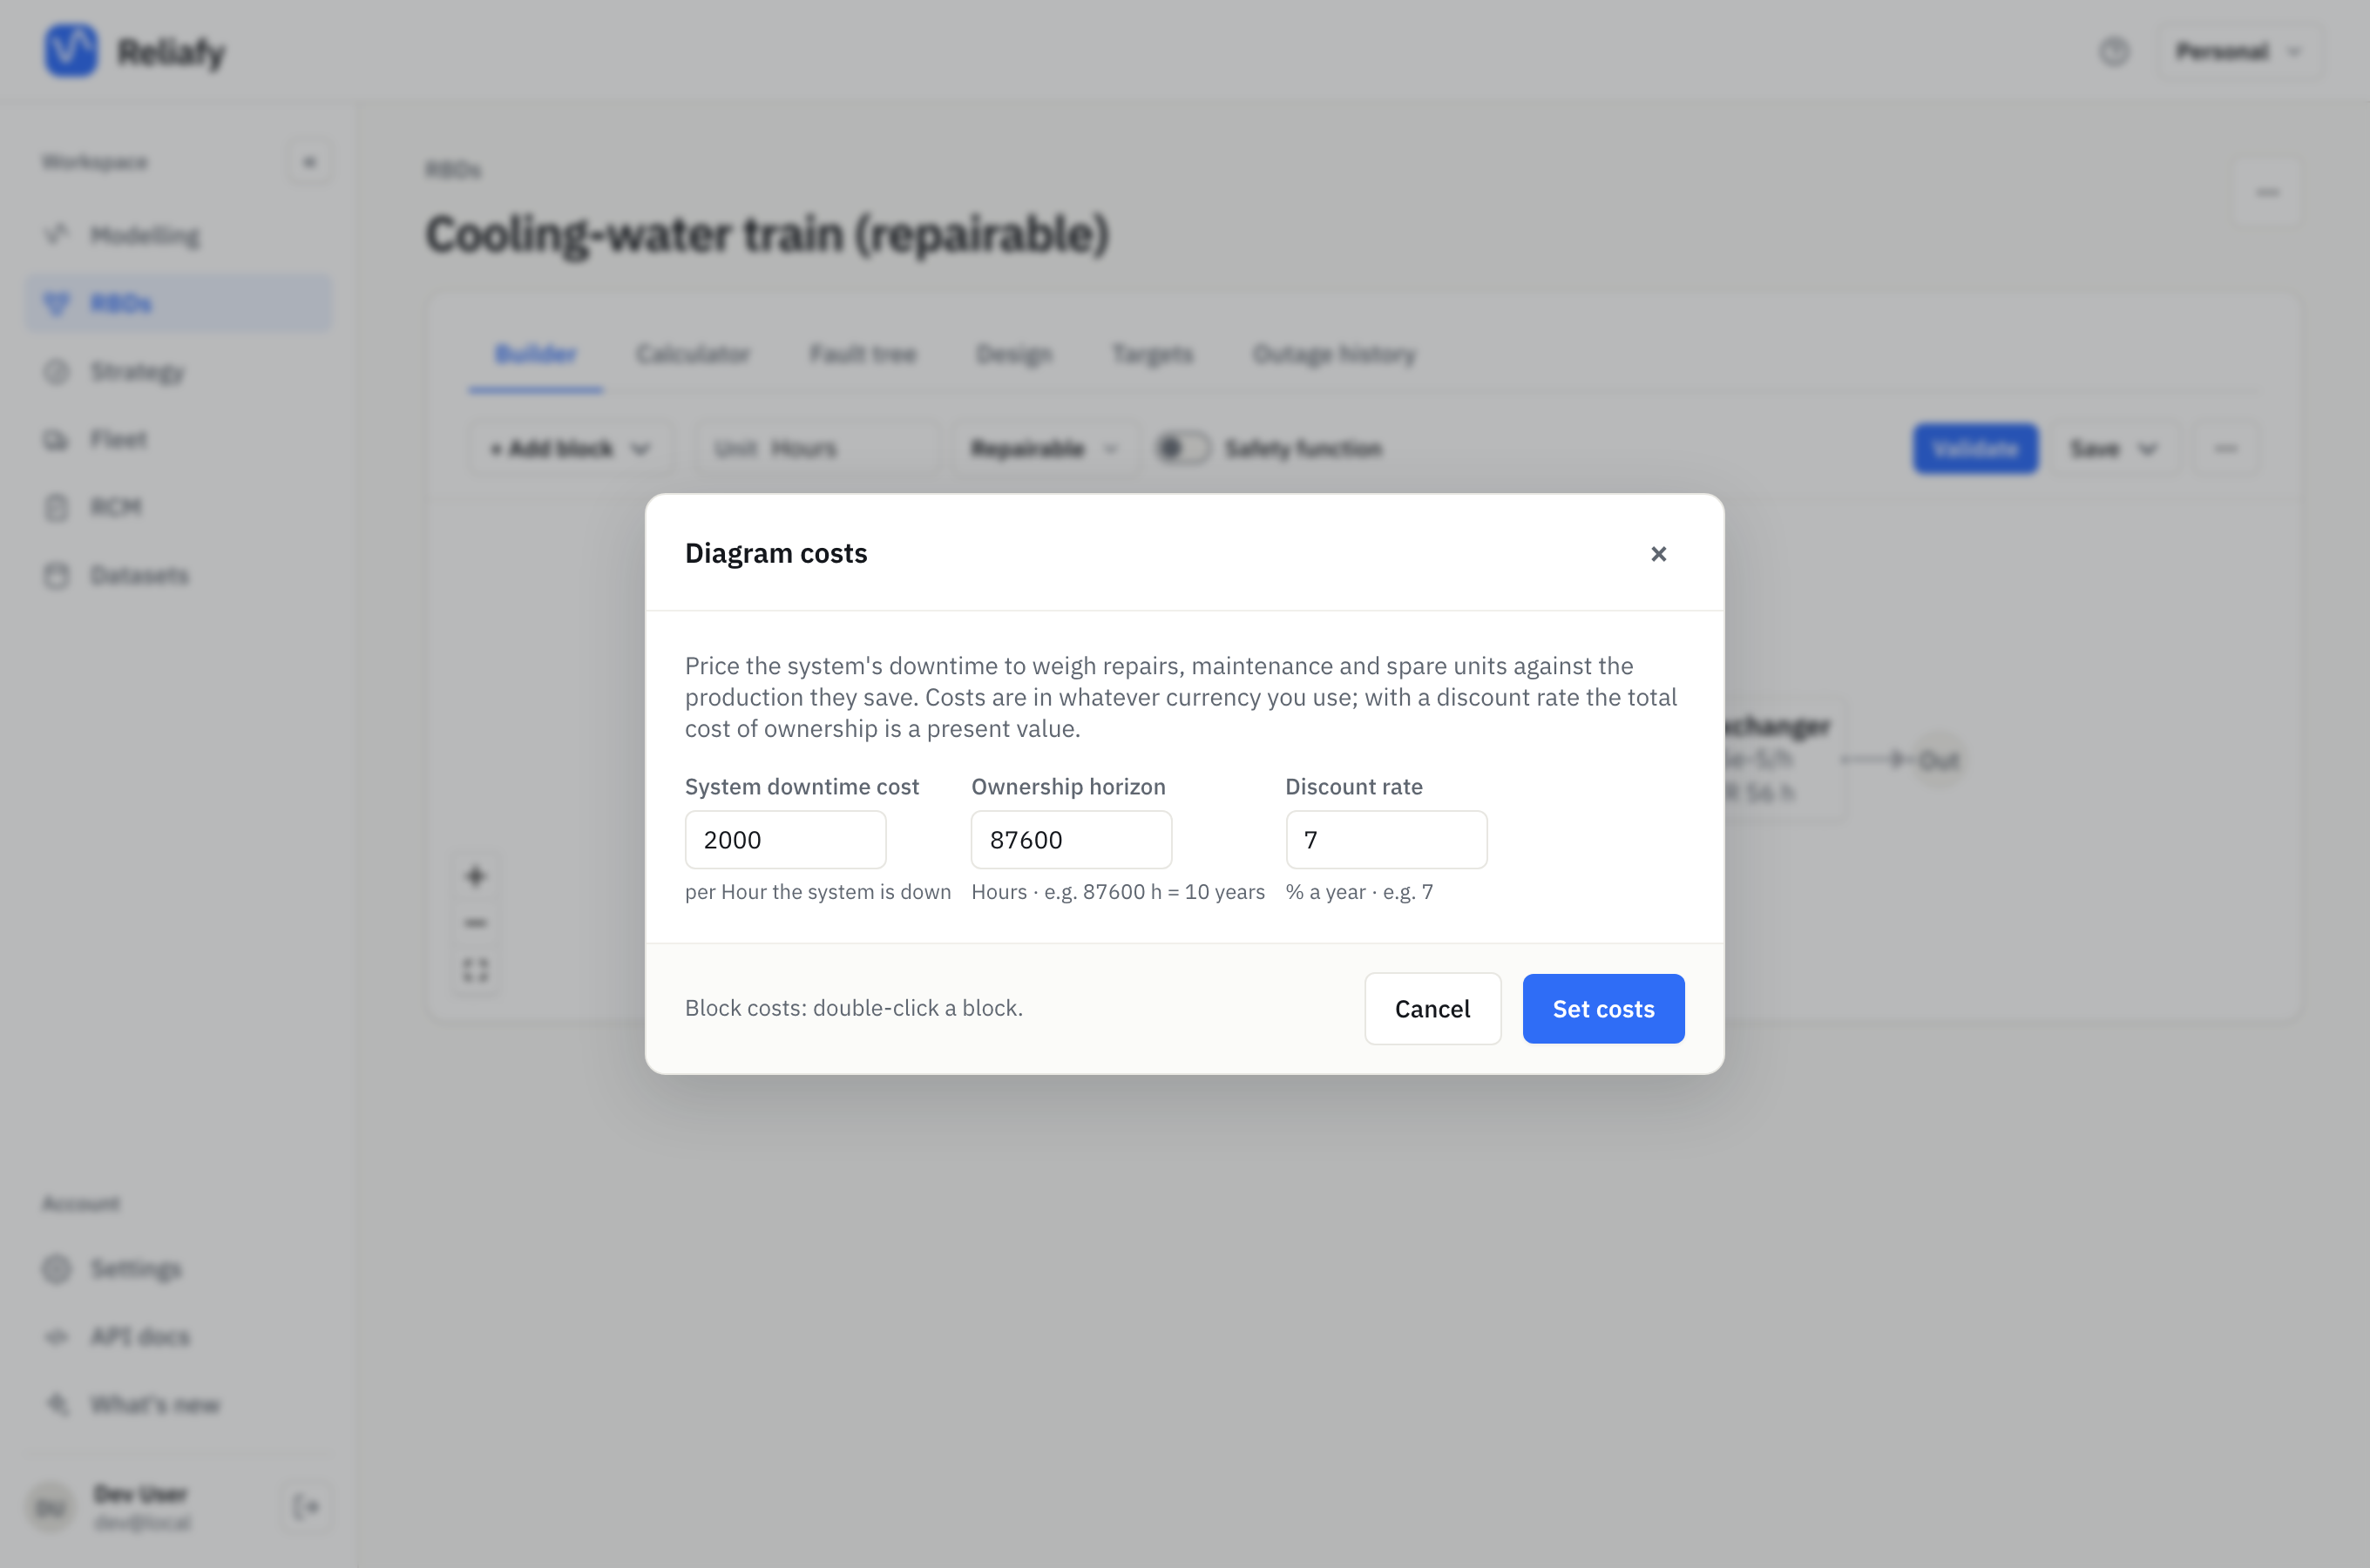
Crews and groups… in the same menu sets how many Repair crews work at once (blank is unlimited) and each maintenance group's Set-up cost per stop. With fewer crews than jobs, a failed block waits for a crew. That is realistic, but for most life models it means the figures are simulated rather than exact.
3. Read the cost of ownership
Validate, open the Calculator tab and press Calculate. The costs are under Details, in Cost of ownership.
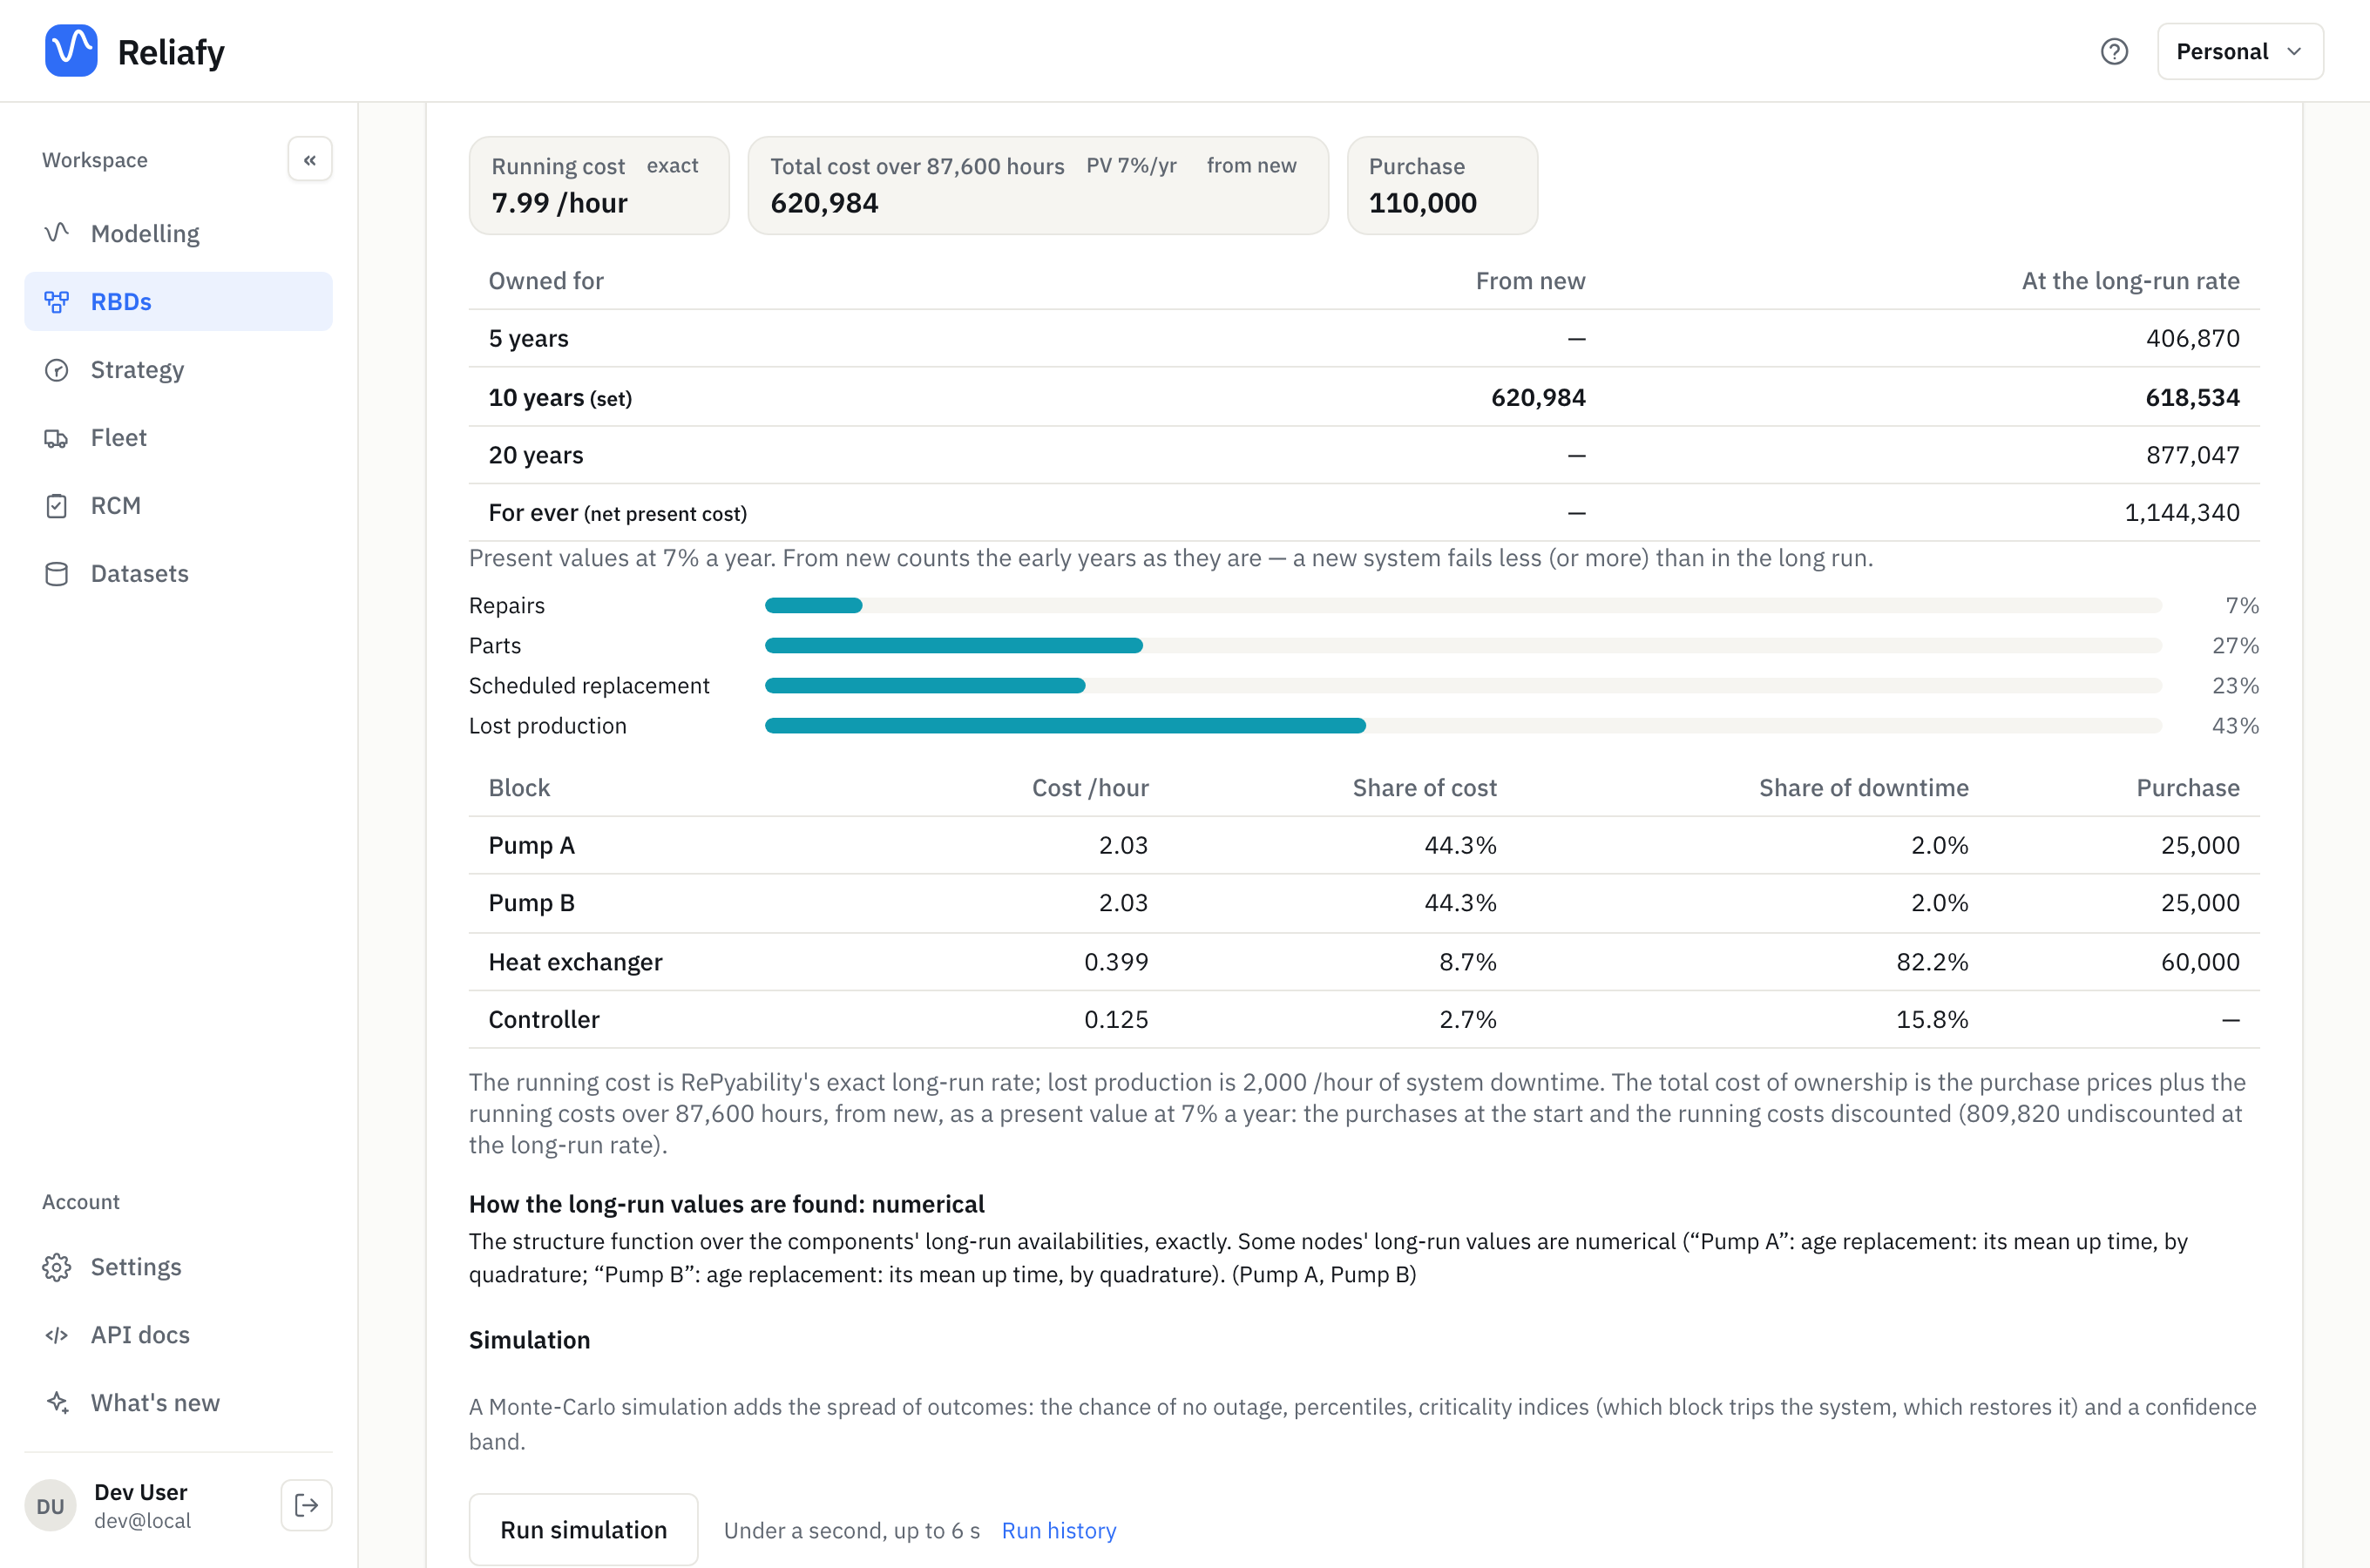
For the train:
- The Running cost is 7.99 an hour, exact.
- Over 87,600 hours (10 years) at 7% a year, the Total cost is 620,984 from new, including the Purchase of 110,000. The table repeats it for 5 and 20 years and for ever.
- The bars split the running cost: lost production 43%, parts 27%, scheduled replacement 23% and repairs 7%.
- The block table shows the trap. The pumps make up 44% of the cost each but only 2% of the downtime. The heat exchanger is 82% of the downtime but only 9% of the cost. The block that stops the plant isn't the one that costs the money.
Downtime: failures vs maintenance above it splits the unavailability into failures and planned work: here 98.9% comes from failures.
4. Choose the intervals
The Design tab's Maintenance and proof-test intervals chooses every block's interval together. A block whose failure stops the system is worth servicing sooner than one with a standby beside it, and doing them together gets that right.
- Under Blocks to choose for, tick the blocks whose intervals may move. The rest keep theirs.
- Choose for: Lowest cost, Lowest cost, availability at least, or Most available within a cost rate. A safety function adds the PFDavg and SIL targets.
- For proof tests, list the Intervals to choose from (blank uses a monthly to four-yearly calendar), and tick Stagger the tests to test redundant channels at different times.
- Press Choose intervals.
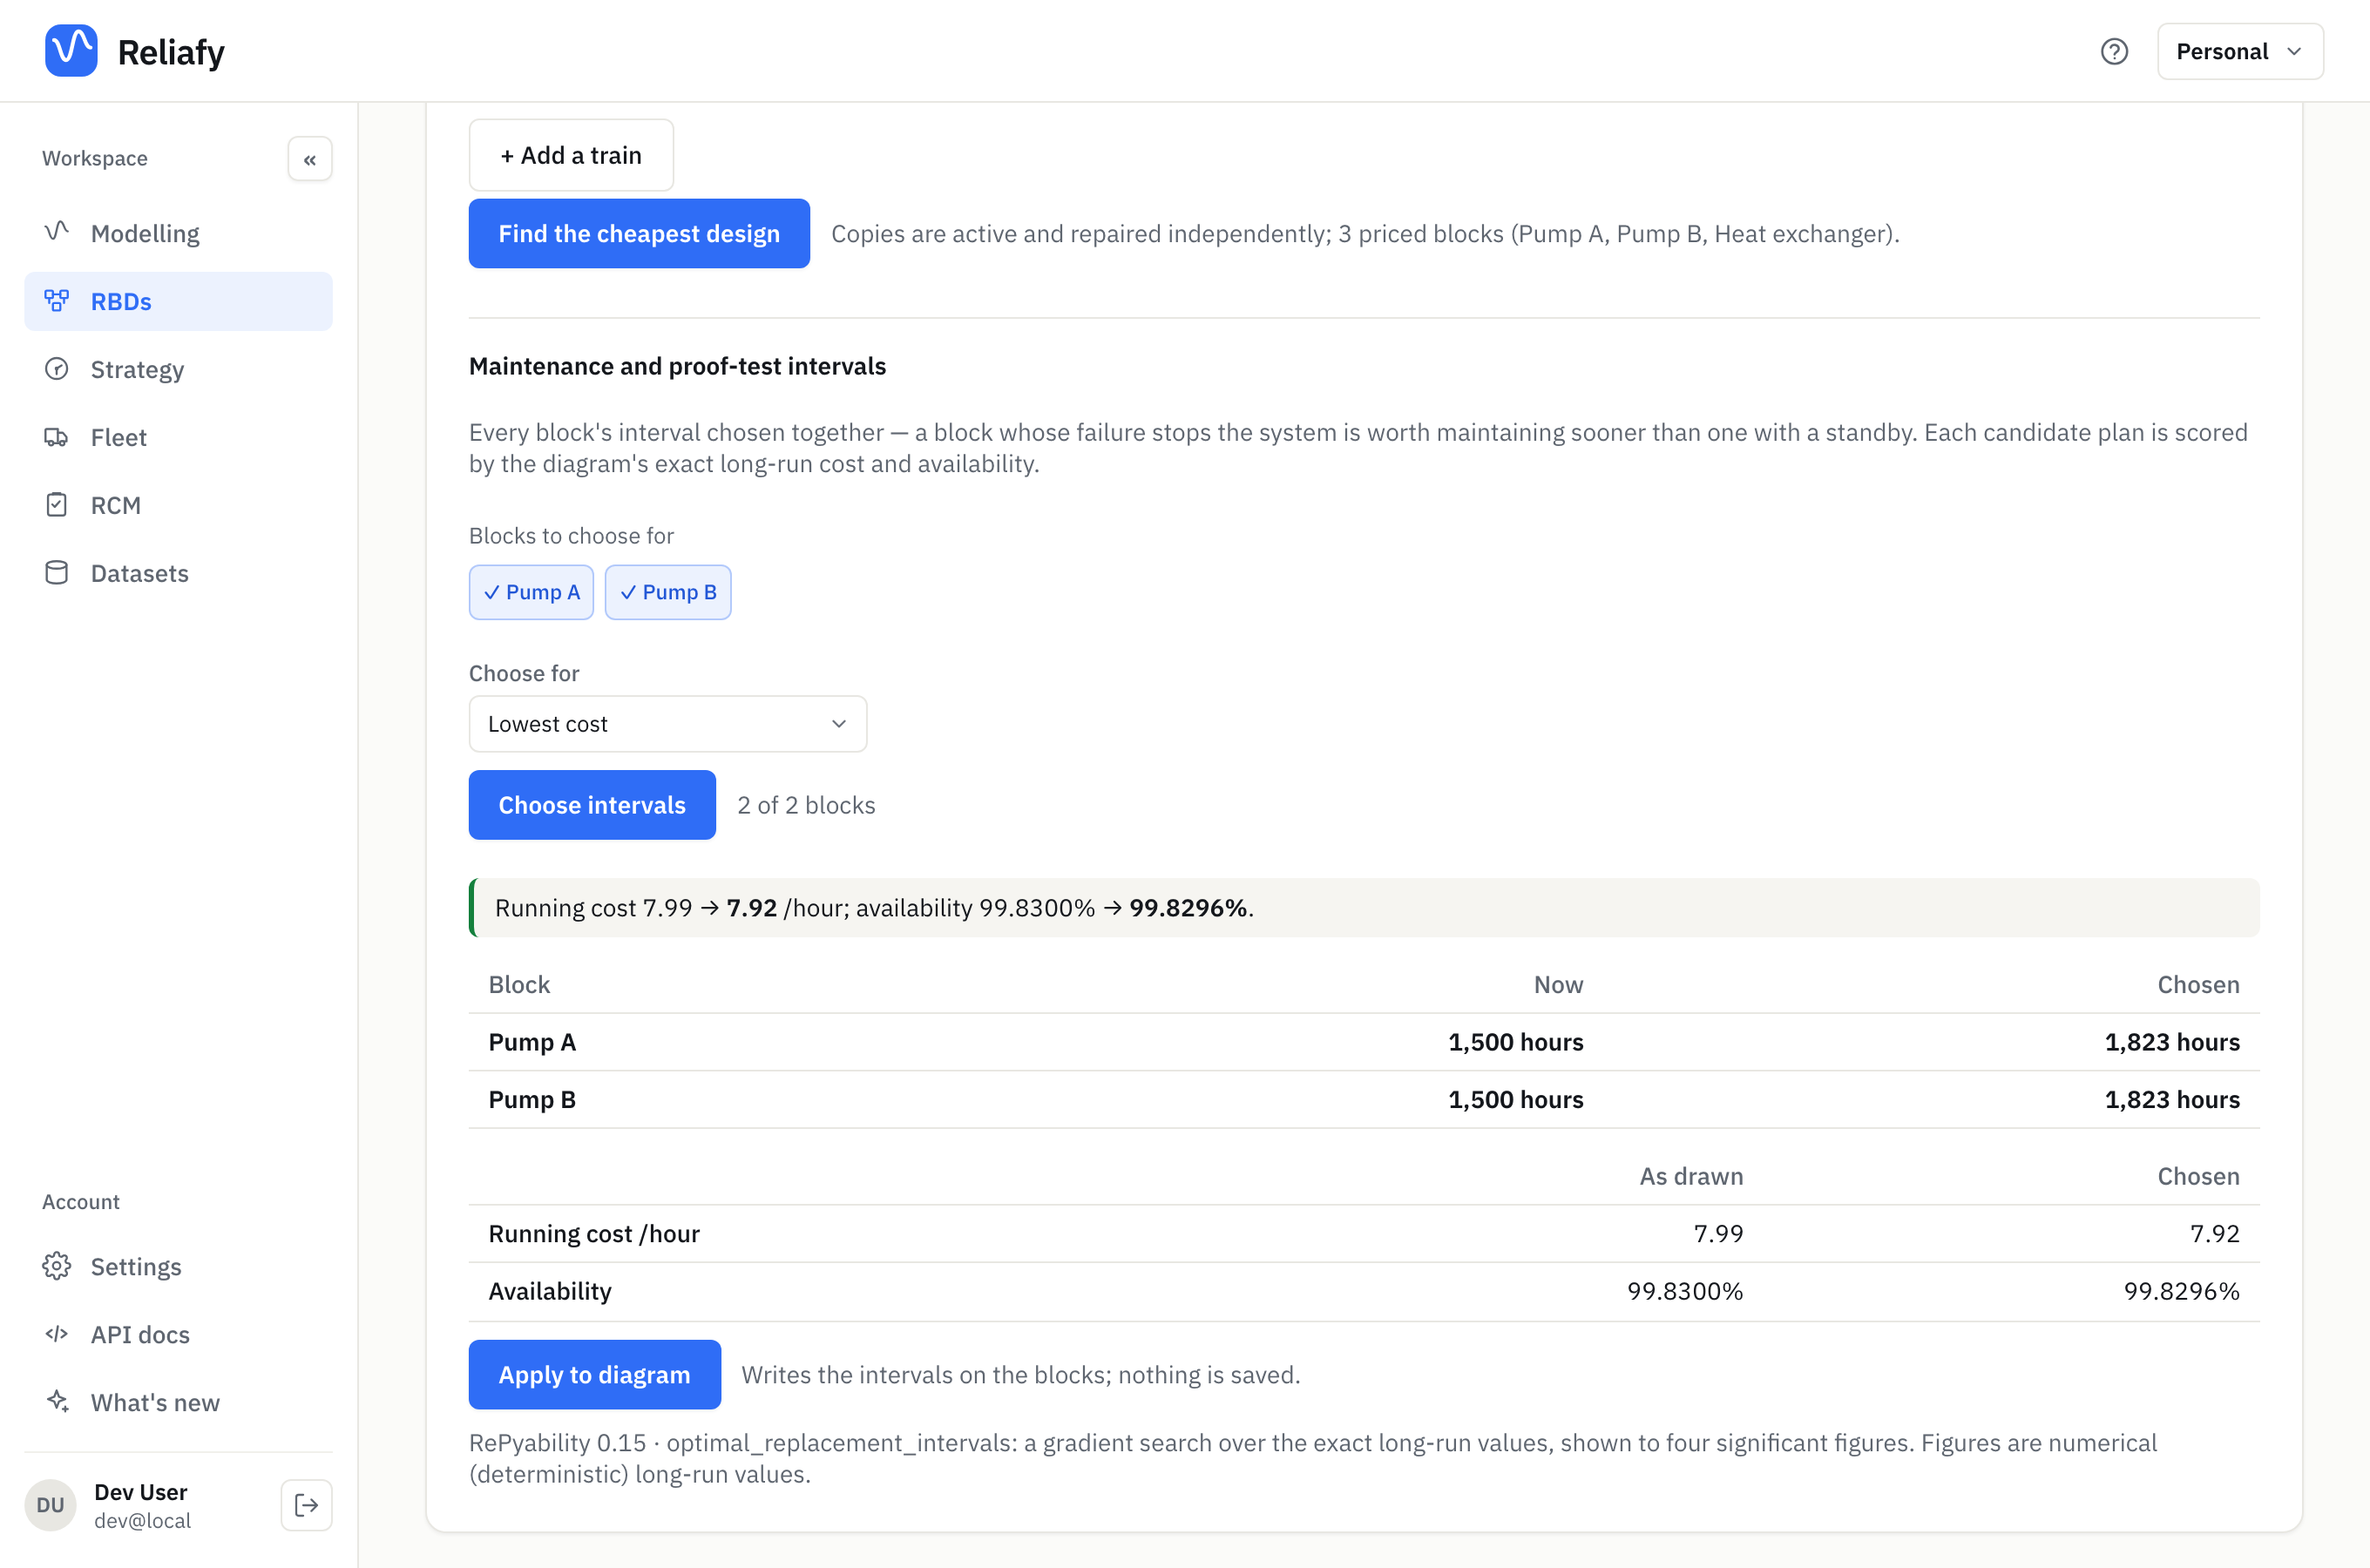
For the pumps, the cheapest age is 1,823 hours rather than 1,500. The running cost falls from 7.99 to 7.92 an hour, and the availability barely moves. A small saving: the 1,500-hour plan was already close. If the intervals as drawn are already the best, it says so.
Apply to diagram writes the intervals on the blocks without saving. Review them, then save. With fewer crews than jobs, the intervals are chosen as if no repair waits; Simulate with your 2 crews (or however many) then checks the plan with the waiting included (a full run is Pro, a quick estimate is free). The same tab also finds the cheapest number of copies to own.
5. Find what to improve
What to improve, under the availability on the Calculator tab, moves each lever one step the way that helps: a block's mean life, its repair time, the spread of either, its maintenance interval, one more crew. It then ranks them by what that step gains.
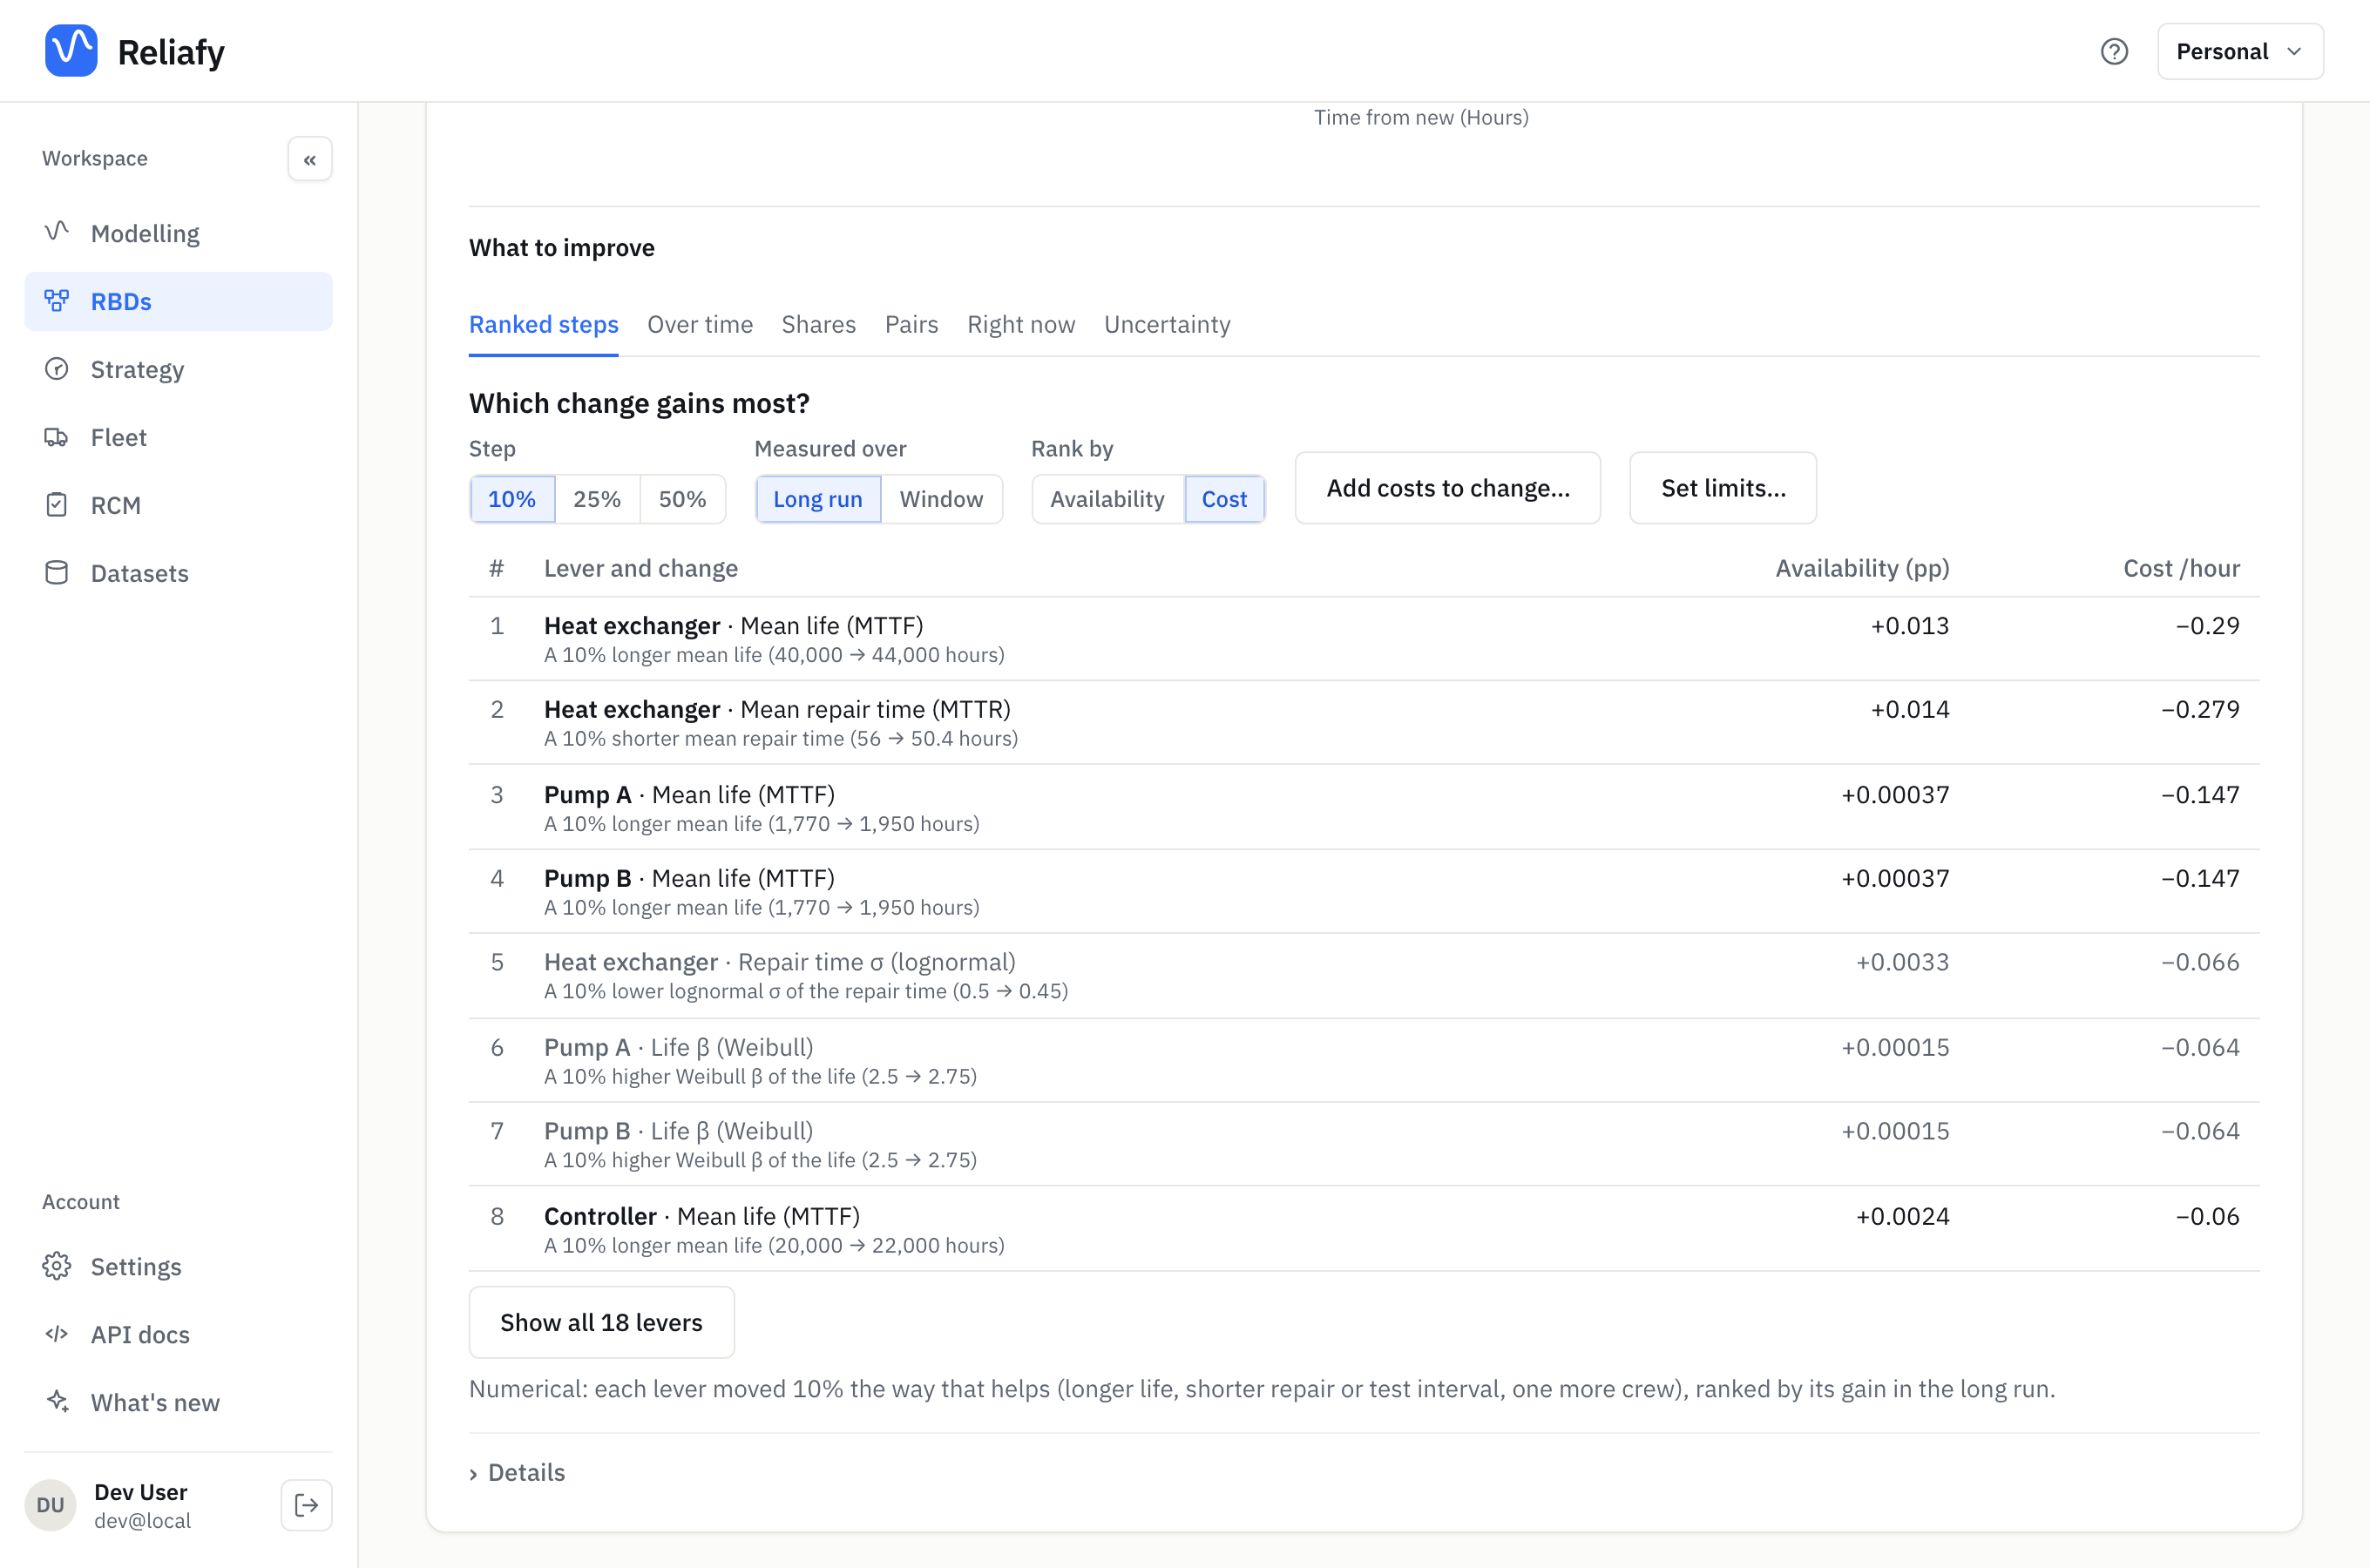
- Step sets how far each lever moves: 10%, 25% or 50%.
- Measured over: the Long run, or the results' Window from new.
- Rank by: Availability, or Cost (the running cost saved per unit of time) once the diagram has costs.
- Add costs to change… lets you say what each change would cost you, and Order by Benefit per cost.
- Set limits… says how far a lever can go: a repair time that can't fall below 4 hours, say.
Ranked by cost, a 10% longer life for the heat exchanger saves most: 0.29 an hour. Next is its repair time, then the pumps' lives, which save money in parts but gain almost no availability.
The other tabs ask other questions of the same diagram. Over time shows which blocks matter most, and when. Shares shows where an all-round improvement would pay off. Pairs finds blocks worth improving together. Right now shows what is moving availability today. Uncertainty shows whose uncertain inputs widen the answer most.
How sure are the numbers?
Most figures here are exact long-run values, and the page says so (exact, numerical or simulated). Two tools add the spread:
- Run simulation under Details gives the range of outcomes: the chance of no outage, percentiles and a confidence band. Runs are kept under Run history. See model system availability.
- Compare with…, also under Details, puts this diagram against a saved copy with one change (a faster repair, a spare unit). Where both allow it, the difference is exact; otherwise both are simulated with the same random numbers, so the interval measures the change itself.
For a non-repairable diagram, the Confidence band on the Calculator carries the fitted blocks' uncertainty through to the system: see B-lives and confidence bounds.
How it works
The running cost is a long-run rate. Each block's cost per unit of time is its cost per event (a repair, a part, a planned replacement) times how often that event happens in the long run. The lost-production cost is the system downtime cost times the system's unavailability. The total cost of ownership is the purchase prices plus the running cost over the horizon. With a discount rate, the purchases count at the start and the running costs are discounted continuously, so it is a present value. "From new" uses the expected costs year by year, since a new system fails less (or more) than in the long run.
Where to go next
- Set a system target and design to meet it for targets per block and the cheapest design.
- Find the optimal replacement interval for one component on its own.
- Verify a safety function for proof tests and the PFDavg.