Forecast fleet failures and spares
Before you start: A fitted life model of the part, and each item's current age or use.
A life model tells you about one part. A fleet is many of them, each at a different age, each running at its own pace. The question a planner actually has is about all of them together: how many will fail in the next twelve months? That number sizes the spares order, the maintenance budget and the crew roster.
A failure forecast answers it from your fitted model and each item's current use. Because it knows every item's age, it gets the timing right: old items near wear-out fail soon, new ones later, and the replacements fitted along the way can fail again inside the horizon.
Read a forecast
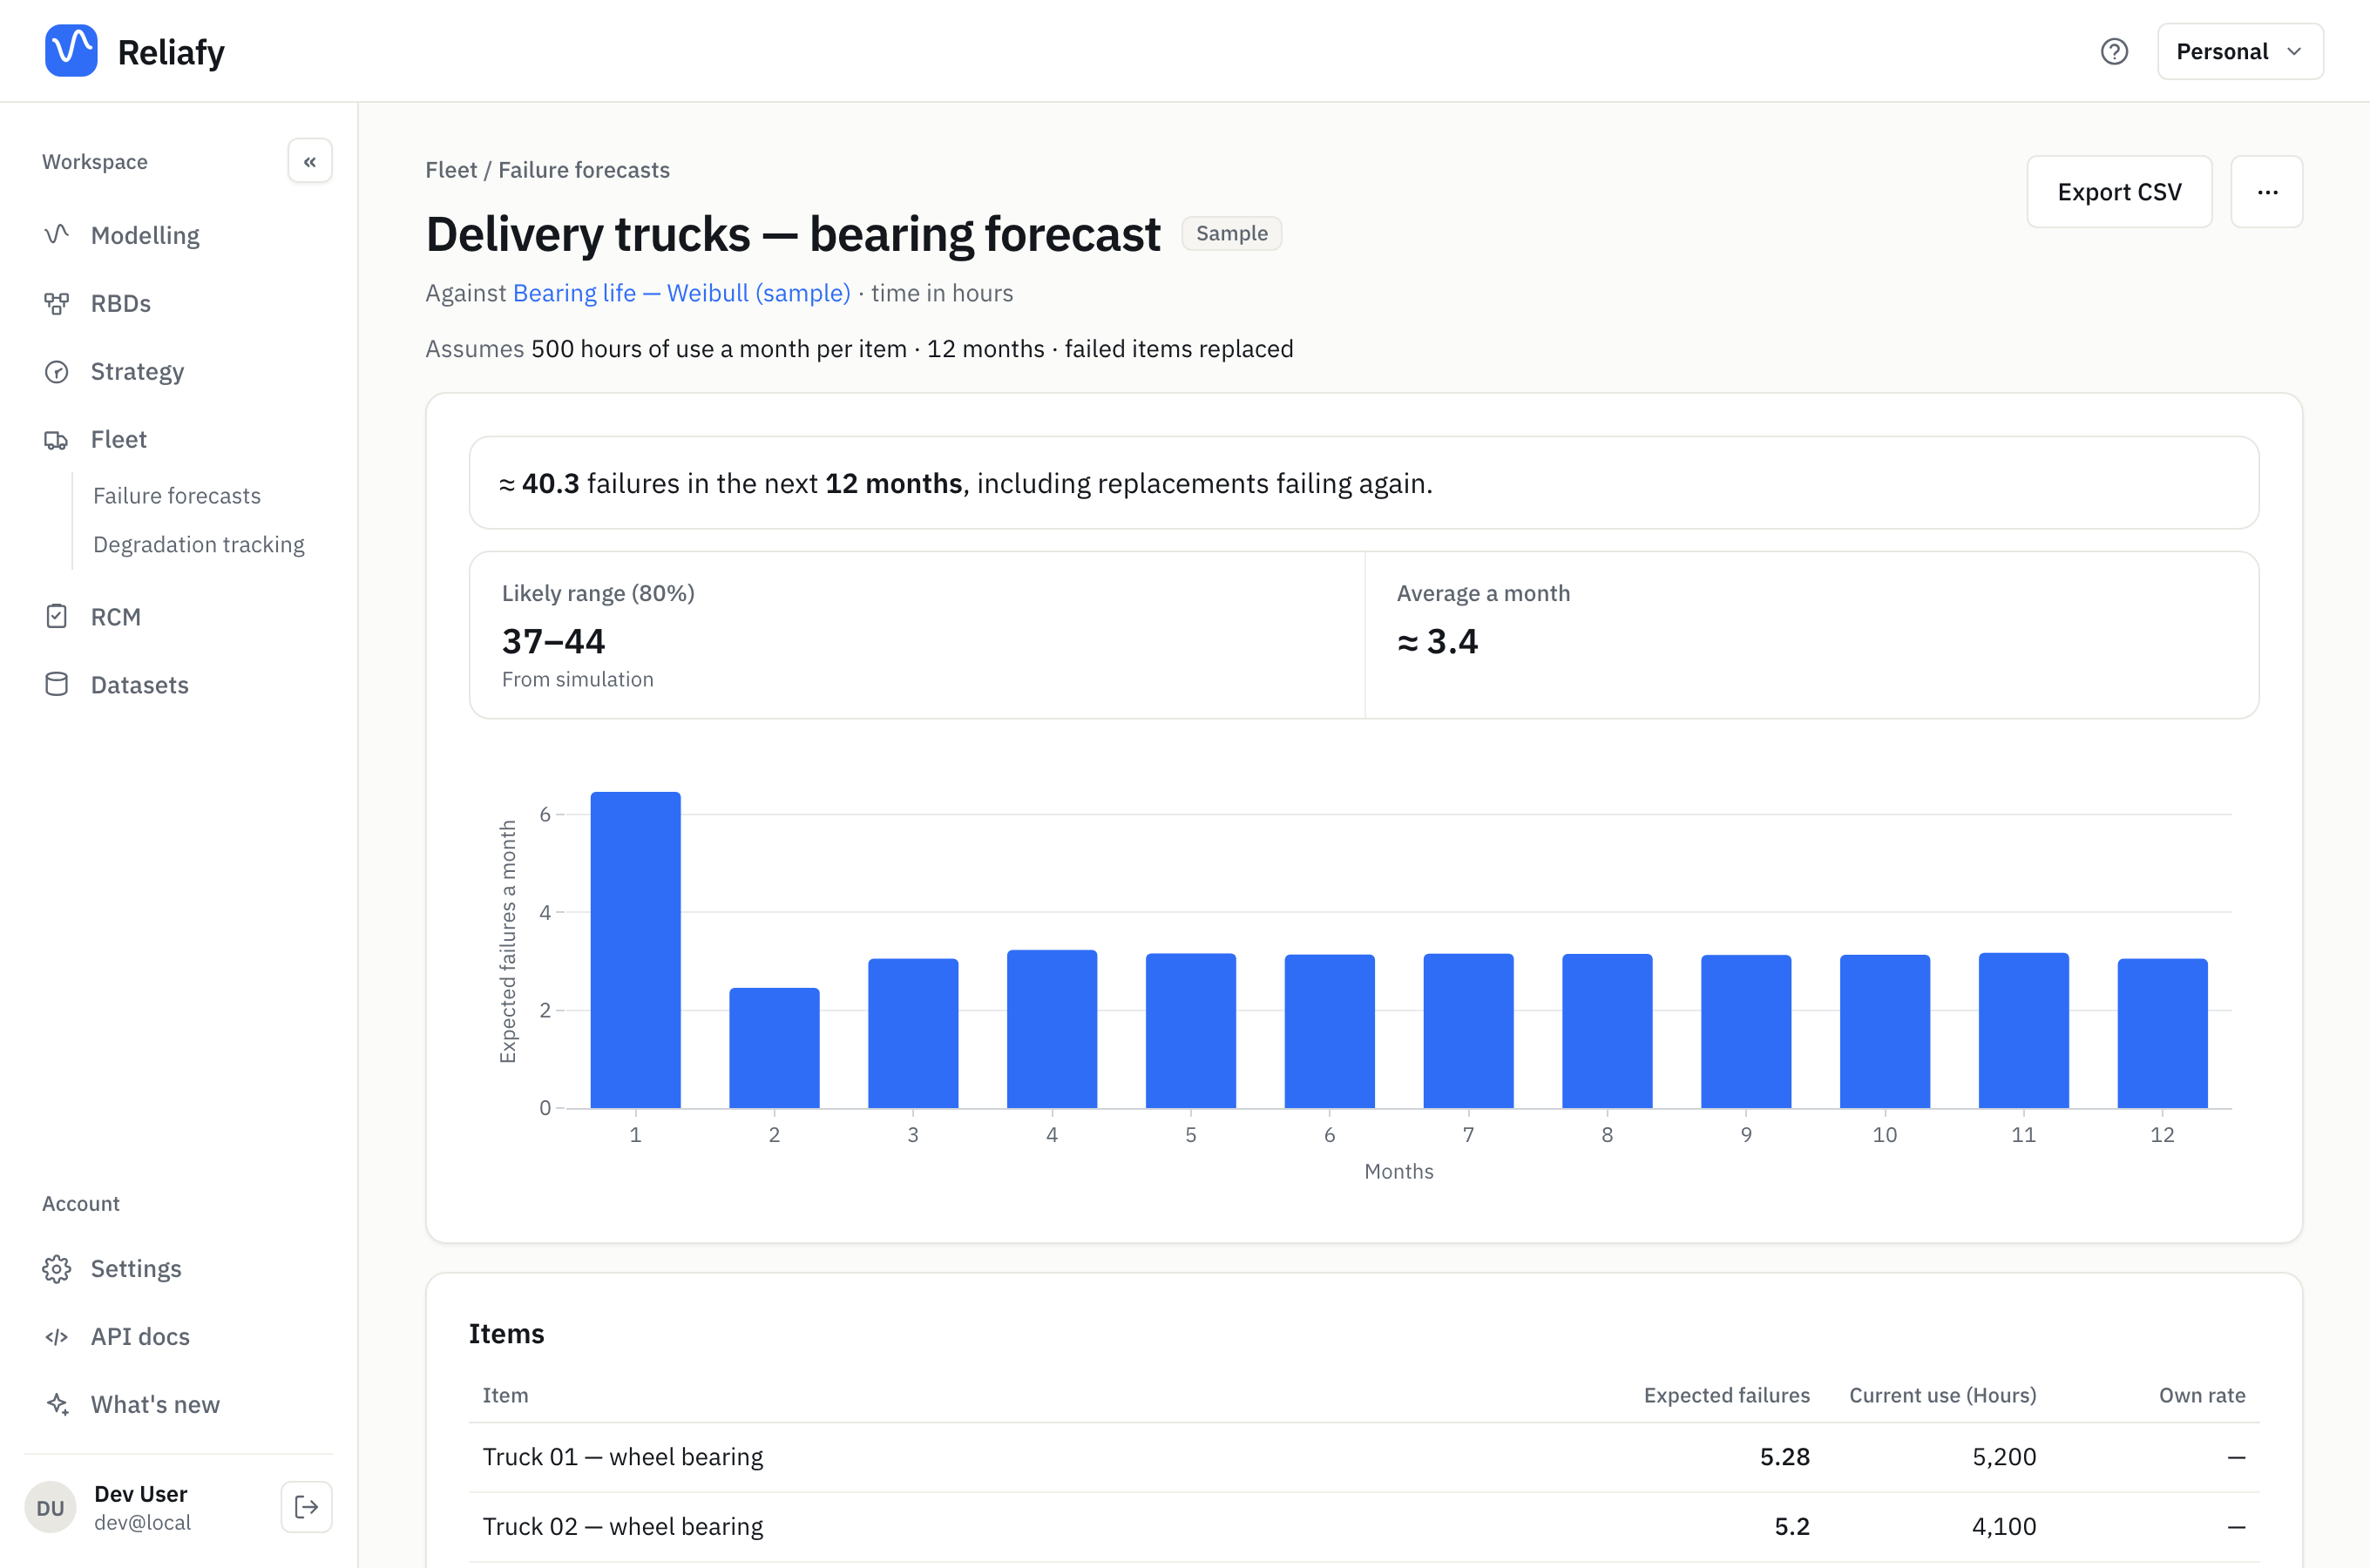
Open Fleet → Failure forecasts and the sample, Delivery trucks — bearing forecast: eight trucks' wheel bearings, against the sample Bearing life — Weibull model. The line under the title says what it assumes: 500 hours of use a month per item · 12 months · failed items replaced.
The answer comes first:
≈ 40.3 failures in the next 12 months, including replacements failing again.
Two tiles sit under it:
- Likely range (80%) — 37–44. In eight years out of ten the count falls in this range; in one year in ten it's above 44. The range comes from simulating the fleet many times, so it includes the chance in which items fail and when.
- Average a month — ≈ 3.4.
The chart shows the expected failures in each month. Month 1 is high (about 6.5) because the oldest bearings, at 5,200 and 4,100 hours, are already past the bearings' characteristic life of 1,440 hours and due to fail almost at once; after that the fleet settles to about 3 a month as replacements cycle through.
Items lists each truck's expected failures over the horizon with its current use. Truck 01, the oldest, expects 5.28 failures; Truck 08, at 350 hours, 4.57. With 500 hours a month and a 1,440-hour characteristic life every item is nearly certain to fail at least once, and the page says so instead of showing a column of 100%s.
From failures to spares
The forecast is a spares figure as it stands, because with failed items replaced every failure uses a spare and each replacement can fail again:
- To cover the expected demand, stock about 40 bearings for the year.
- To cover demand in nine years out of ten, stock to the top of the likely range: 44.
- For a monthly reorder, the profile shows the first month needs more than the rest — about 7, then about 3 a month.
Whether to stock to the expectation or the top of the range is a cost decision: the price of a stock-out (a truck off the road) against the cost of holding four more bearings.
Export CSV downloads the forecast for a purchasing system or a budget sheet: each item's expected failures and chance of failing, the fleet's expectation and its range, and each month's expectation and range.
Build your own forecast
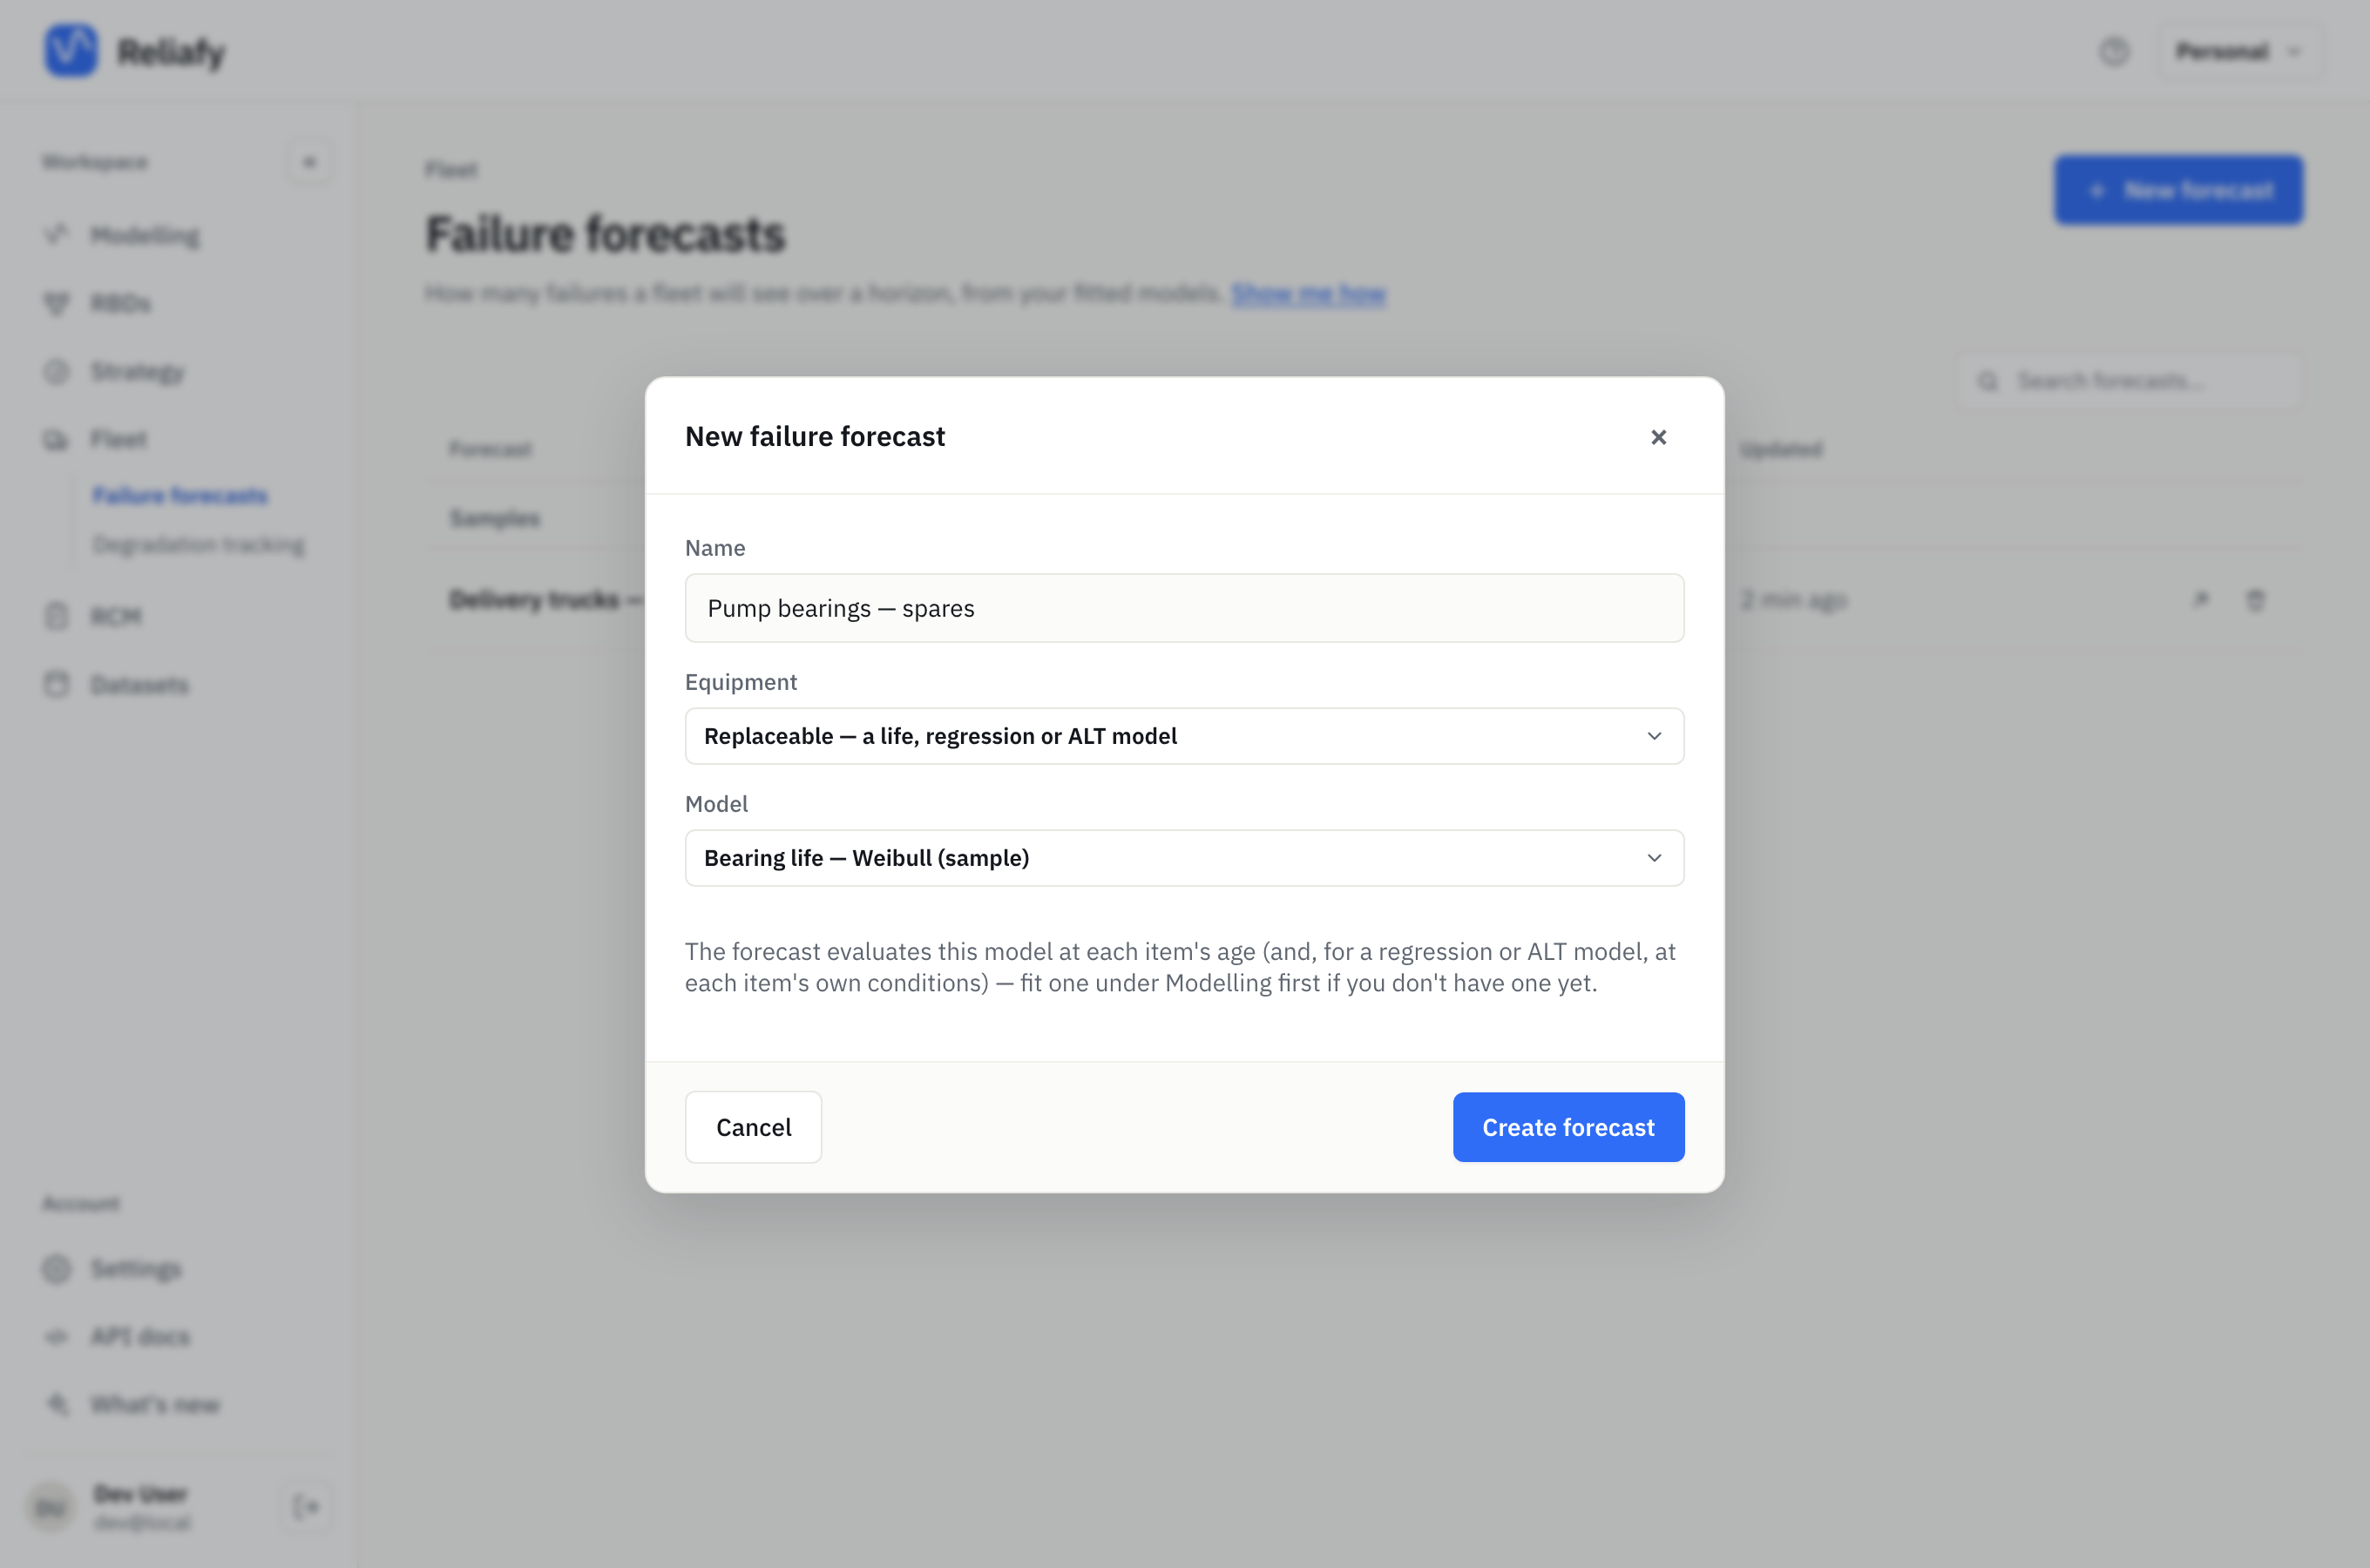
- On Fleet → Failure forecasts, press New forecast. Give it a name, choose the Equipment — Replaceable (a life, regression or ALT model) or Repairable (a recurrent model) — and the Model. With a regression or ALT model each item is forecast at its own conditions or stress.
- Add item for each unit in service, with its Current use (its age in the model's time unit). An item can have its Own rate if it runs harder or lighter than the rest.
- Set the Usage per month for the fleet, the Horizon (12) and the Period (months, weeks, years…).
- Press Save & forecast.
Under Advanced:
- Counting method — Failures with replacement (the default) for spares demand; First failures only to ask which items are at risk. With first failures only, a Most at risk list ranks the items by their chance of failing within the horizon, and you can set warranty limits so failures after an item's warranty aren't counted.
- Usage rate — Manual (the usage typed here) or Estimated from API readings: each item's rate learned from meter readings sent through the API, so the forecast follows how the fleet is actually being used.
For Repairable equipment each failure is repaired and the item runs on, so every repeat failure is counted from the item's age.
Get told when it changes
Once a forecast is saved, the Alerts card can email you when it crosses a level you set: when the expected failures rise above N, change by more than P%, or reach X or more within Y months. Alerts are checked each time usage for the fleet arrives through the API, so they suit fleets whose meters report in automatically.
Where to go next
The forecast is only as good as the life model under it, so fit the model to your own failure data where you can. If the part is replaced on a schedule rather than at failure, find the optimal replacement interval first: it changes how many failures there are to forecast.