Import a diagram from BlockSim, Open-PSA, Galileo or Excel
Before you start: A diagram file: a BlockSim project (.rsgz / .rsr / .rsrp), Open-PSA XML, a Galileo .dft, RePyability JSON, or an Excel workbook of blocks and connections.
You don't have to redraw a system you've already modelled somewhere else. Reliafy reads diagrams from the common reliability tools and from a plain spreadsheet, turns each one into a block diagram, and opens it in the builder for you to check.
Nothing is saved until you say so. The import shows you the diagram and a short list of import notes: anything that didn't come across exactly, and anything you need to set before the numbers mean something.
Import the file
Open RBDs in the sidebar and press Import at the top of the page. Pick the file. Reliafy works out the format from what's inside it, so the file extension only has to be roughly right.
- If the file holds one diagram, it opens straight away in the builder.
- If it holds several (a BlockSim project usually does, one per folio), you get a list: This file holds 4 diagrams. Pick one to open. Each row shows its number of nodes, or why it couldn't be read. Open the one you want; you can come back and import the file again for the others.
The diagram opens unsaved, under a note that says where it came from:
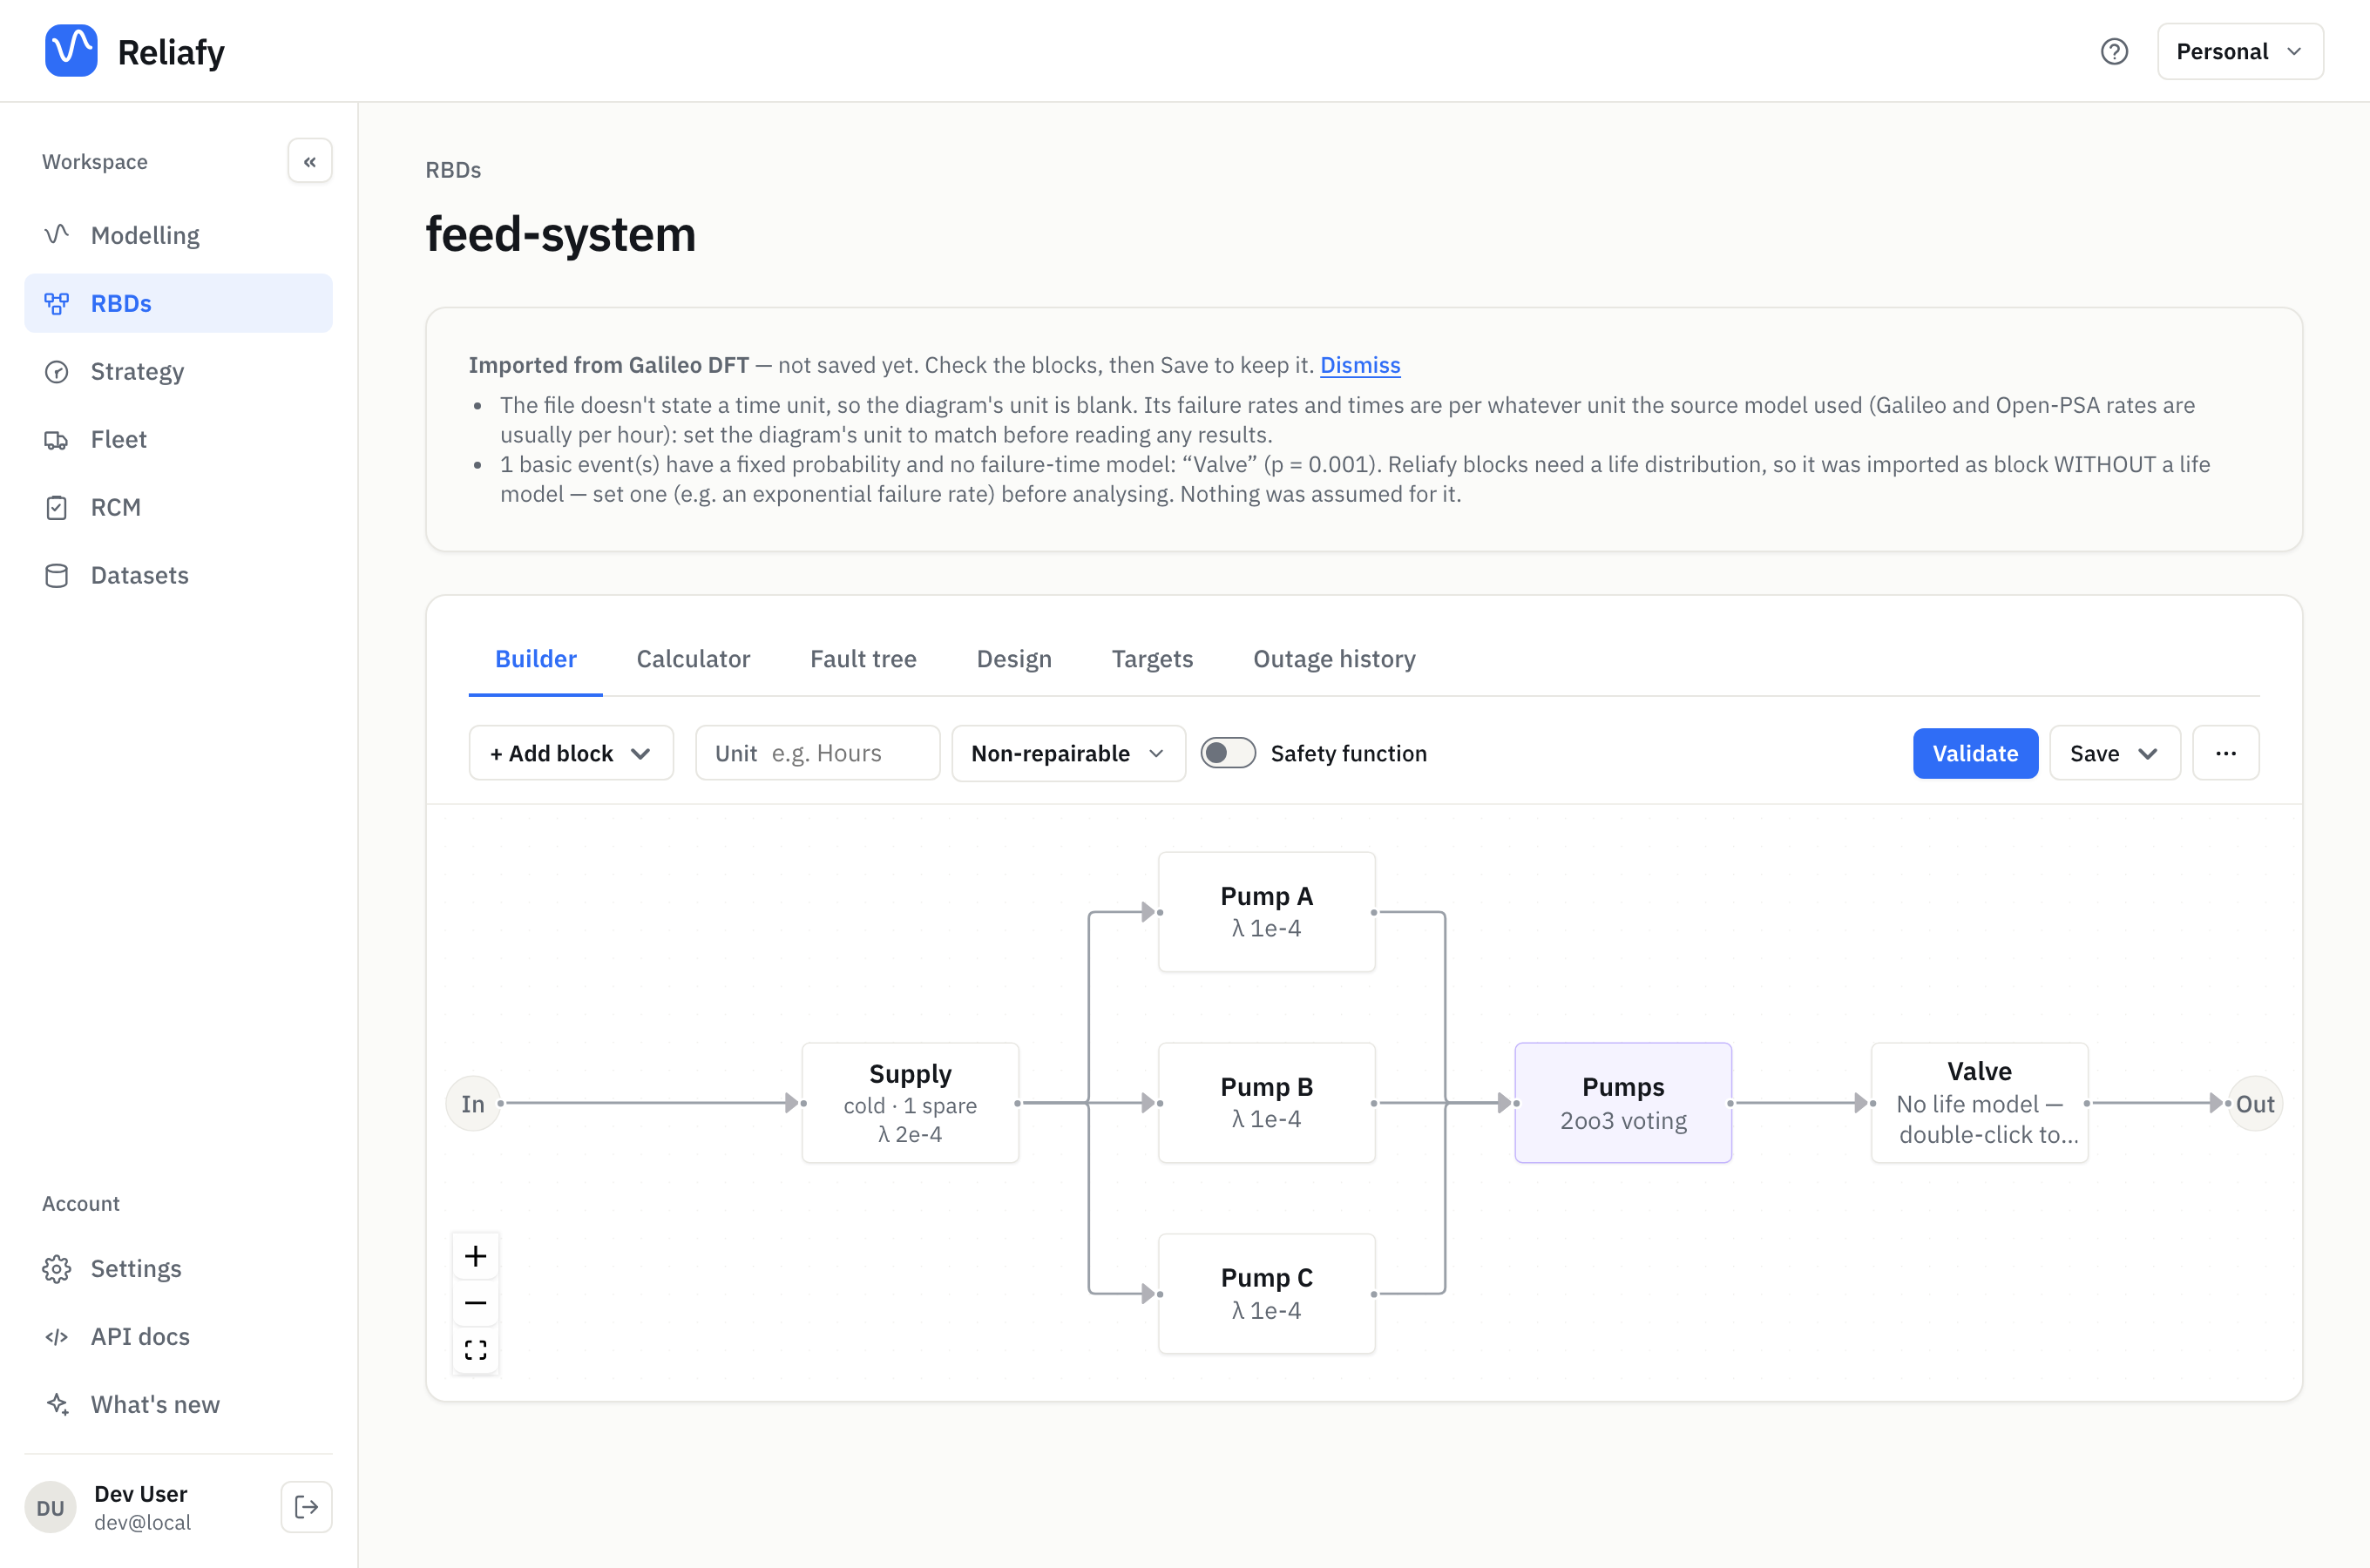
This example is a small Galileo fault tree: a supply with a cold spare, three pumps of which two must work, and a valve. The OR gate at the top became a series chain, the 2-of-3 gate a 2oo3 voting node, and the cold-spare gate a standby block with one spare.
Read the import notes
The notes are the part to read carefully. Two are common:
- No time unit. Galileo and Open-PSA files often don't say what their rates are per. The diagram's Unit is then left blank. Rates in these formats are usually per hour: type Hours in the toolbar's Unit box, or whatever the source model used. Reliafy never rescales the parameters, so the unit only labels them; it has to match.
- A block with no life model. A basic event with only a fixed failure probability (the valve above, p = 0.001) has no failure time to model. Reliafy won't invent a failure rate for it, because that would change the answer. It imports as a block marked No life model: double-click it and set one, such as an exponential failure rate, before you calculate.
Press Validate once you've dealt with the notes. It names any block still missing a model and any wiring problem. Then Save. Saving is the moment the diagram counts towards your plan's storage.
What each format brings across
Each format holds slightly different things. Reliafy brings across what has an exact equivalent, approximates only where the note says so, and refuses what it can't import honestly.
ReliaSoft BlockSim (.rsgz, .rsr and .rsrp project files, version 9 onwards)
- Blocks with Weibull, exponential, normal or lognormal models. A block with another ReliaSoft model imports without a model, and the note lists its raw values so you can set it.
- Node blocks become voting nodes. Subdiagrams are drawn in place, with the block's name as a prefix.
- Standby containers with one active unit and matching spares become standby blocks (cold or hot by the dormant model).
- Load-sharing containers of identical exponential units become one block with the exact life. Any other load-sharing container comes in as a plain k-of-n, which errs on the cautious side, and the note says so.
- Fault-tree folios become their block-diagram equivalent: an OR gate is series, an AND gate is parallel.
- Repair times come across, and the diagram imports as Repairable, only when every block has a corrective task Reliafy can read. Otherwise the repair data is dropped with a note.
Open-PSA (Model Exchange Format XML, including XFTA's dialect)
- AND, OR and at least k gates; house events and constants.
- Basic events with exponential, Weibull or GLM data (GLM's repair rate becomes an exponential repair). A periodic-test event comes in as its failure rate, and the note says the test schedule isn't modelled.
- Parameters, including rates in FIT (failures per 10⁹ hours), which are converted to a rate per hour.
- Beta-factor and MGL common-cause groups.
- An event used under several gates becomes a repeated block: drawn in each place, analysed as one component.
- Refused: non-coherent logic (NOT, XOR, NAND, NOR and the like), because a block diagram can't express it.
Galileo (.dft, as used by Storm and DFTCalc)
- AND, OR and k-of-m gates; cold, warm and hot spare gates become standby blocks.
lambda=rates (exponential),phases=(Erlang) and Storm's Weibull and lognormal forms.repair=rates make the diagram repairable when every event has one.- Refused: the dynamic gates with no block-diagram equivalent (PAND, POR, SEQ, FDEP, PDEP, MUTEX) and spares shared between gates.
RePyability JSON
- A file you downloaded from Reliafy comes back exactly as it was: labels, positions, unit, costs, safety settings and links to your saved models.
- A file written by RePyability in Python comes across block by block: parametric life and repair models, repeated and standby nodes, common-cause groups, and the maintenance settings of a repairable diagram. Models Reliafy can't hold (load-sharing, non-parametric, regression) import as blocks without a model, listed in the notes.
Excel (.xlsx, .xlsm)
See the next section.
Build one from a spreadsheet
A spreadsheet is often the quickest way to get a long list of blocks in. On the RBDs page, open the ⋯ menu and choose Download Excel template. It has three sheets:
- README: every column explained, and the parameters each distribution takes.
- Blocks: one row per block. An ID, a Name, a Type
(component when blank, k-of-n, standby, series or parallel), the
Distribution and its parameters (
alpha,beta,mu,sigma,failure_rateorMTTF), and the Unit. k-of-n blocks take Required; standby blocks take Spares and Dormancy (0 cold, 1 hot). - Connections: one row per arrow, From and To, by ID or name.
Blocks with nothing feeding them connect from the diagram's input, and blocks feeding nothing connect to its output. So a plain list with no connections at all imports as a series system, with a note saying so.
Give every block an MTTR (or a repair distribution) and the diagram imports as Repairable, ready for availability. Leave it out and it imports as non-repairable.
Your own workbook doesn't have to follow the template. If Reliafy doesn't recognise the layout, it asks you to map it: choose the Blocks sheet and its header row, then Next: map columns to say which column is which. For the wiring, pick a Connections sheet, or choose None to use Feeds / Fed by columns on the blocks sheet. Then Import diagram.
Take it back out
Once a diagram is saved, the builder's Save menu offers two downloads:
- Download as RePyability JSON: the diagram in RePyability's format. Load
it in Python with
rbd_from_json, or import it back into Reliafy later exactly as it was. (Links to saved models come back only for someone who can open those models; anyone else gets the blocks with their parameters.) - Download as Python: a standalone script that rebuilds and runs the diagram (see build a reliability block diagram).
Limits
- A file can be up to 50 MB.
- An import never changes the parameters. If a note says something was approximated or dropped, the diagram is still usable, but check that block.
- The import reads the file as data: nothing in it runs.
Where to go next
With the diagram in, the rest is the same as for one you drew yourself: validate and calculate it, or switch it to Repairable for availability. If you have real outage records for the system, compare the diagram with its outage history.
Agents and scripts can import too: the uploads tool's import_rbd action over
MCP takes the same formats.