Model a network: will two points stay connected?
Before you start: A sketch of the network: the points that can fail, how they link up, and a life model for each.
A block diagram has a direction: from input to output, through series and parallel paths. Many real systems don't. A water main, a power grid or a communications network is a mesh, and what matters is whether two points (a plant and a town, a substation and a feeder) stay connected by some path of working elements, whichever way it runs.
Some meshes can't be drawn as series and parallel at all. The classic is the bridge: two routes with a tie across the middle that can carry flow either way. A Network diagram handles these directly.
When to use a network
Use a network when:
- links can carry flow in either direction, and
- the question is "are these two points still connected?"
Use an ordinary block diagram when the logic has a direction, or needs voting (k-of-n), common-cause groups, repair or a safety function. A network supports none of those, and it isn't repairable.
Build it
Open RBDs → New diagram and set the menu beside Unit in the toolbar to Network. The canvas works as usual, with three differences in meaning:
- Each block is a point that can fail, with a life model. A pipe segment or a line that can fail is drawn as a block between the points it joins.
- Each connection is a link that works both ways and never fails. Its direction on the canvas is ignored: wire it whichever way is easier.
- The two terminals are the points whose connection you care about: the input and output by default, which never fail. You can choose any two blocks instead.
Add blocks with + Add block or a right-click on the canvas, and set each block's life model by double-clicking it, as in any diagram. Junctions and voting nodes aren't offered: in a network, a point where lines meet is just a connection.
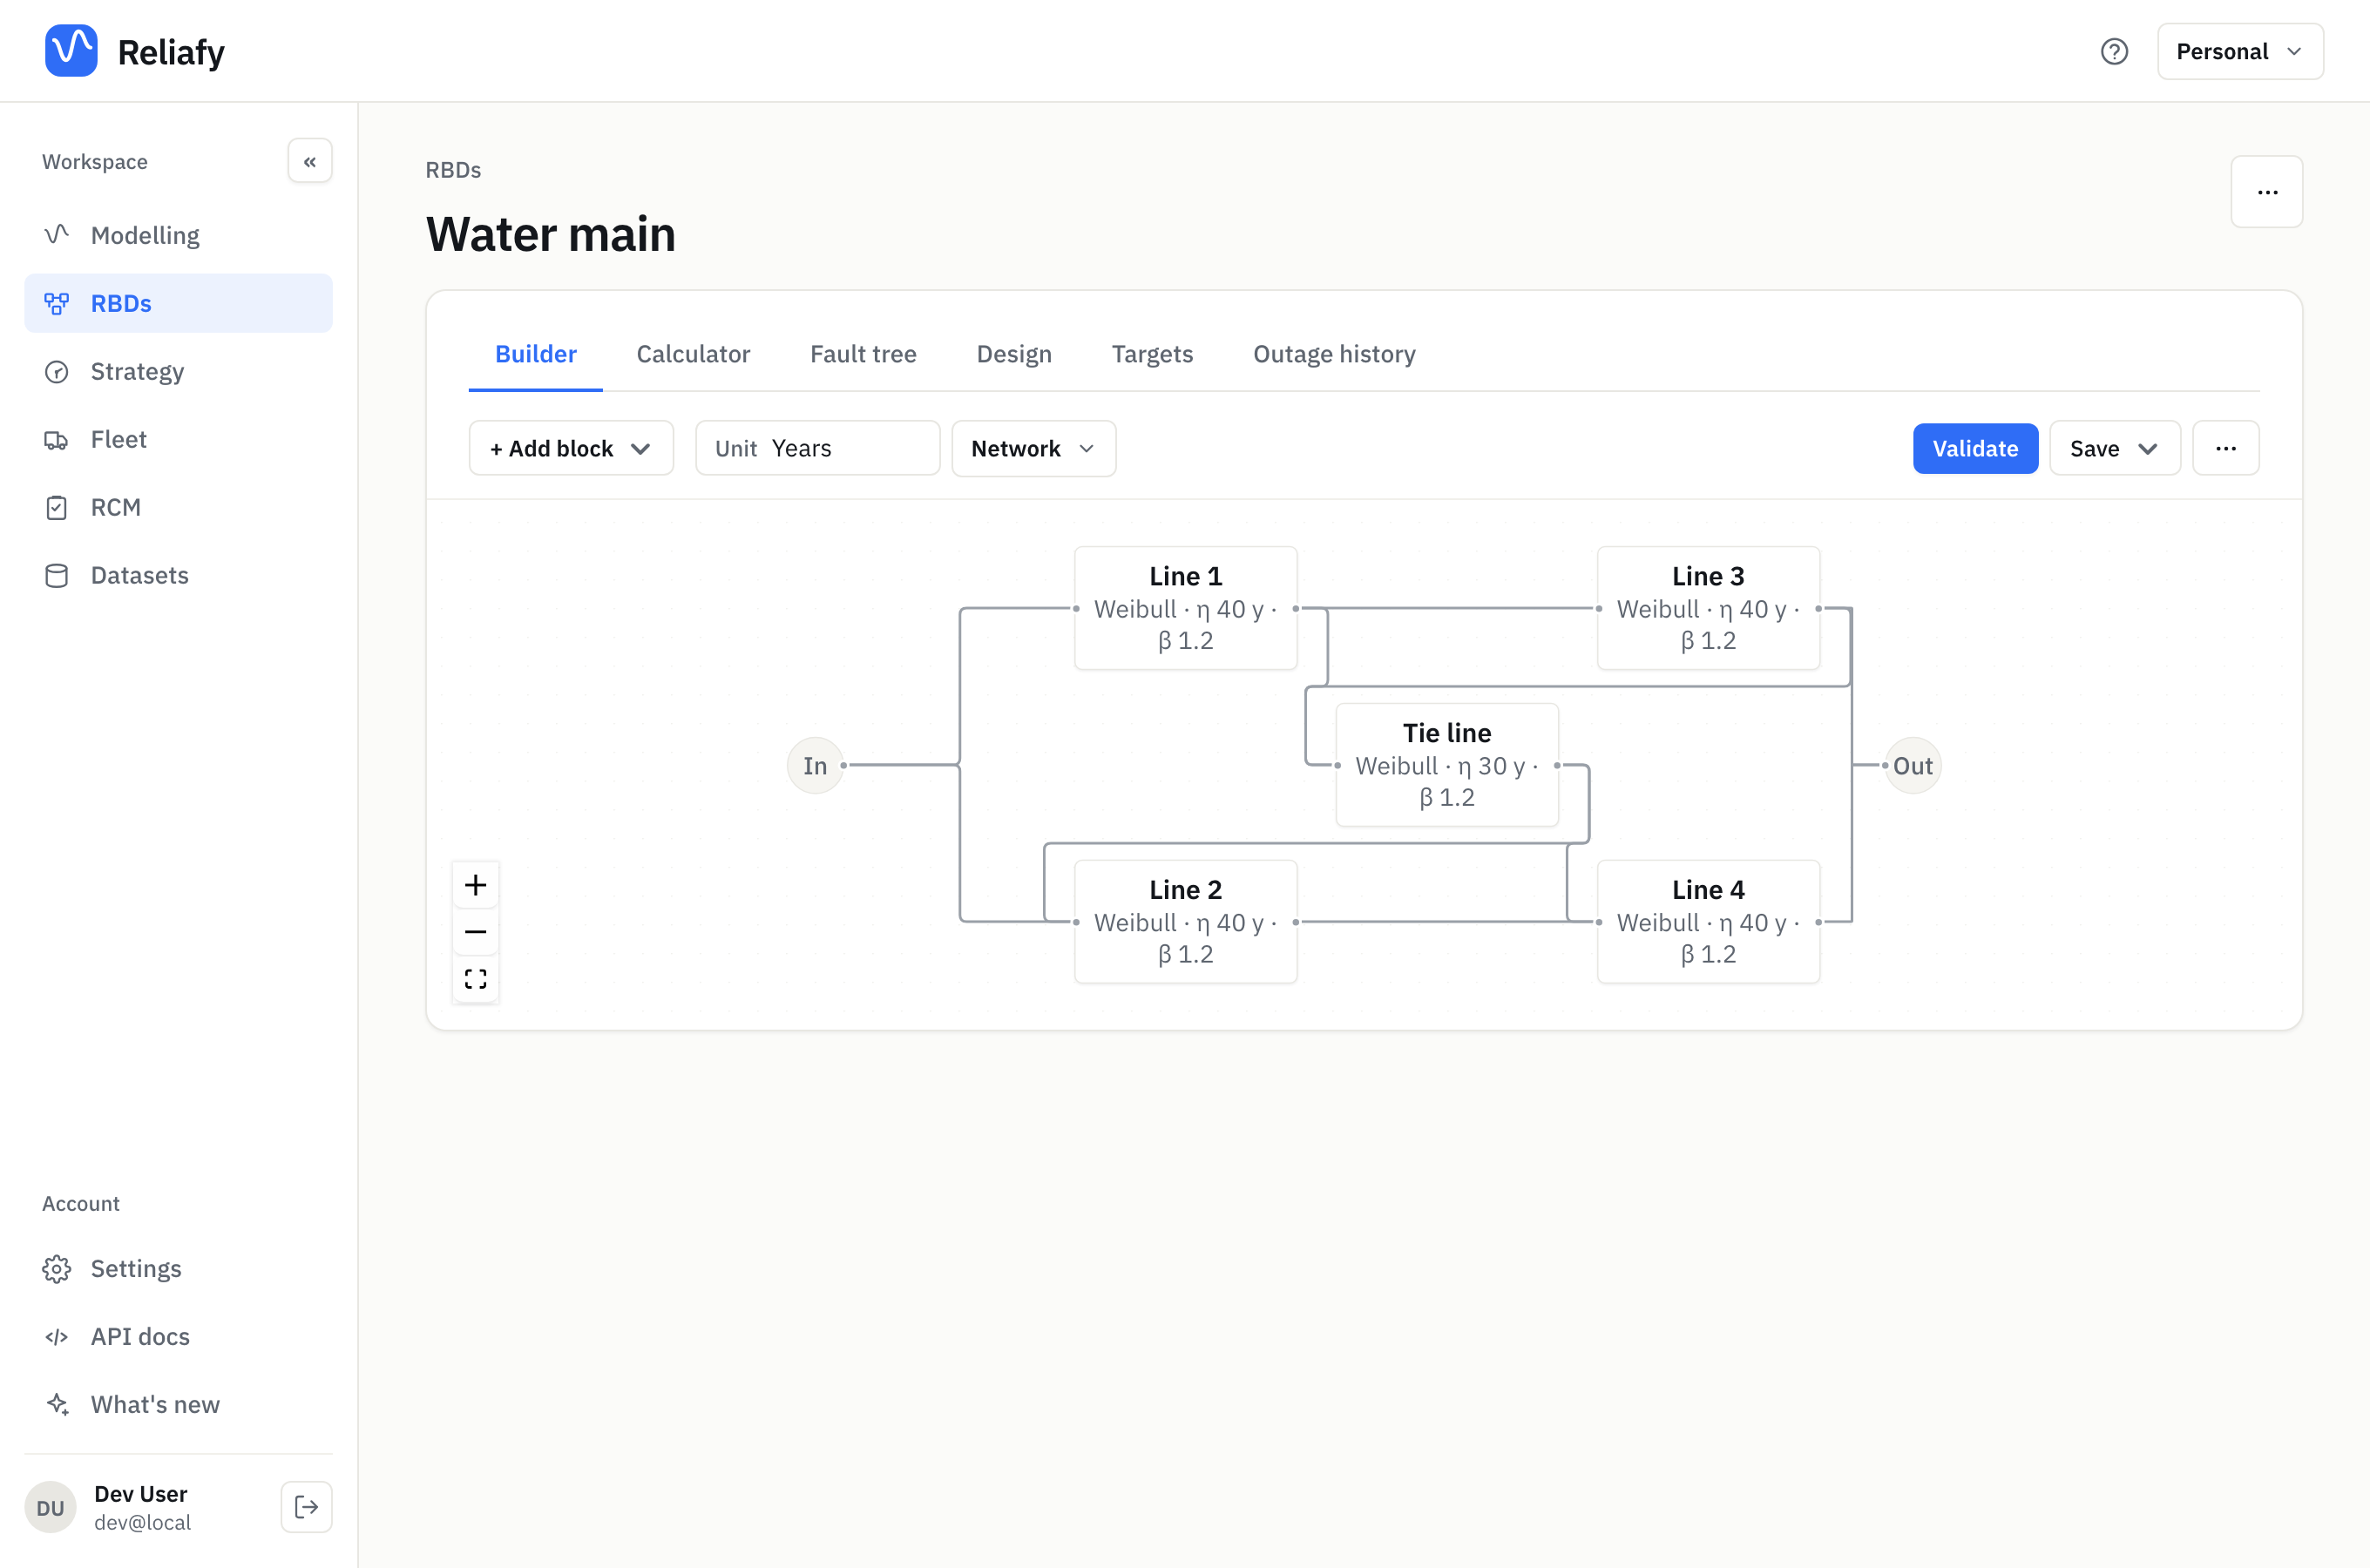
The example is a water main. The plant (input) feeds the town (output) through two routes, Line 1 then Line 3, or Line 2 then Line 4. A tie line joins the two routes halfway, so water can cross from either route to the other. Each line has a Weibull life with a scale of 40 years and a shape of 1.2; the tie line, 30 years.
Read the result
Open the Calculator tab. Choose the terminals under From and To, and a time under At t. Left blank, the time is chosen where the connection is about 90% reliable.
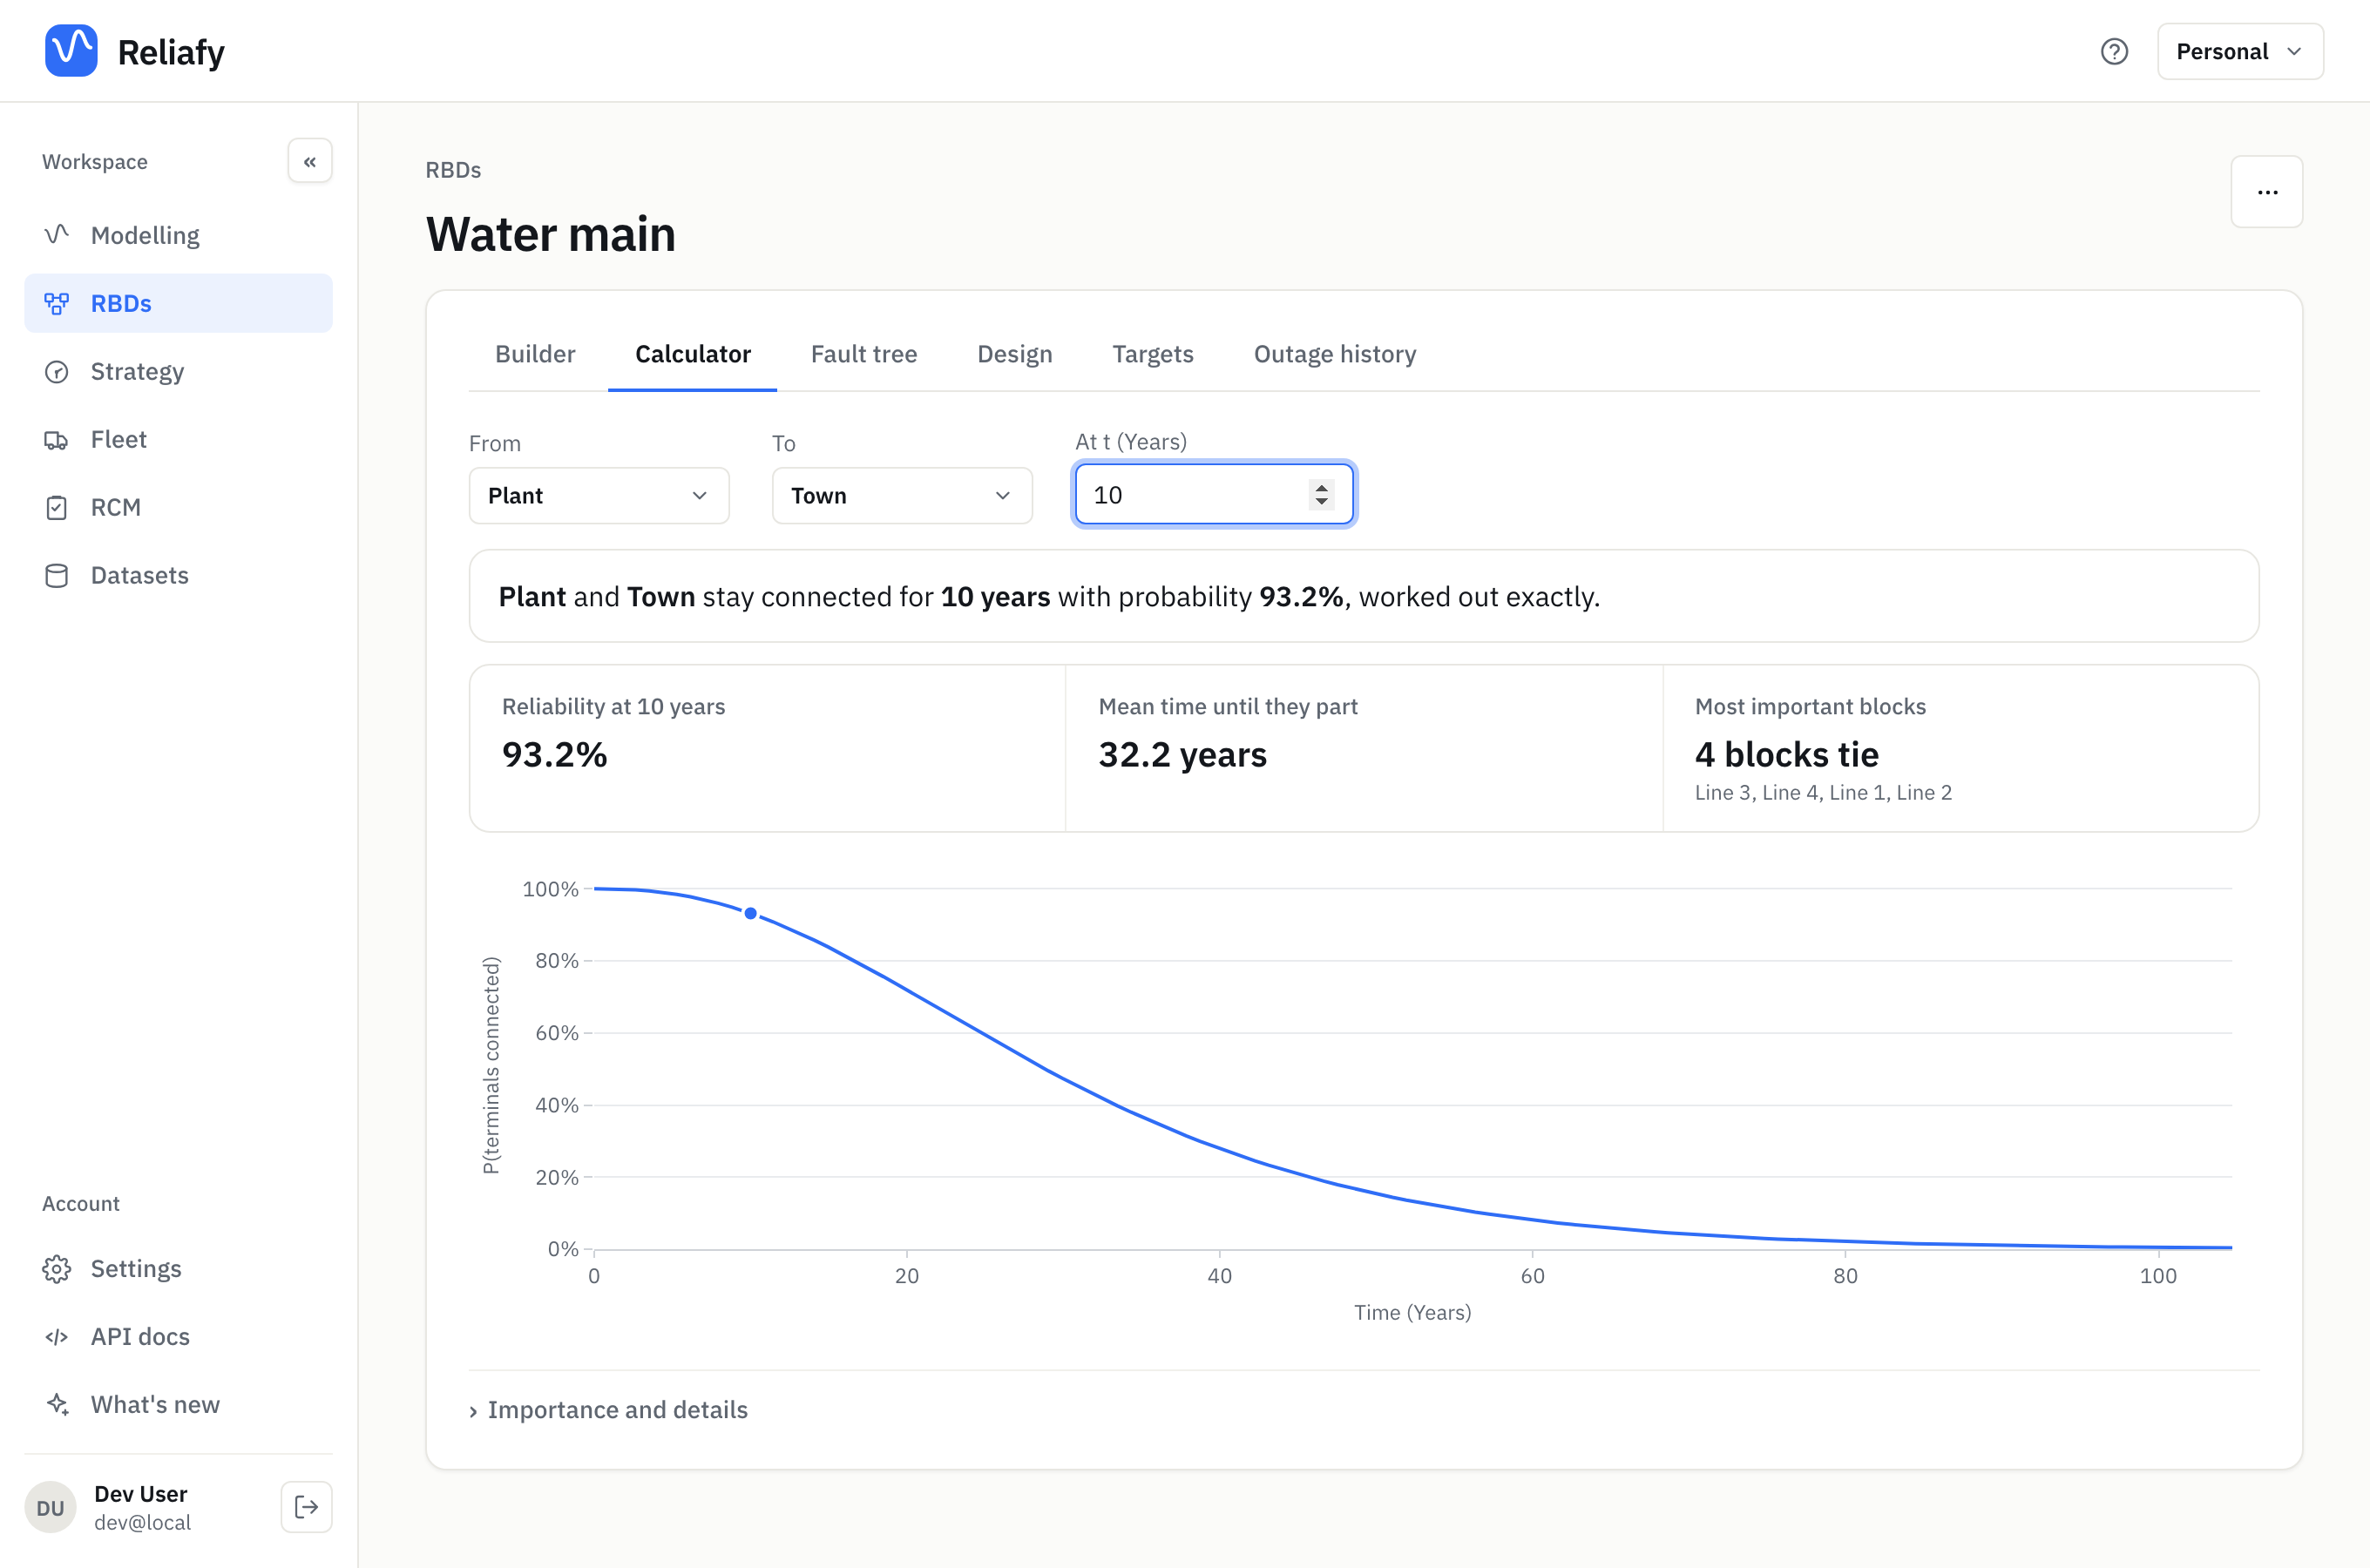
The answer is one sentence: Plant and Town stay connected for 10 years with probability 93.2%, worked out exactly. Beside it:
- Reliability at the time you chose: the chance the terminals are still connected then.
- Mean time until they part: the expected time until no working path joins them, here 32.2 years.
- Most important block(s): the blocks whose improvement would gain most.
The curve shows the chance of staying connected over time.
What did the tie line buy? Take it out and the same network is two independent routes, an ordinary parallel system: 90.1% at 10 years and a mean of 30.4 years. The tie line adds about three points of reliability at 10 years, even though it's the least reliable element in the network.
Importance and details lists every block's Importance with its own reliability at the chosen time. Importance here is Birnbaum's: how much the connection's reliability rises if the block never fails, compared with if it has already failed. In the example the four lines tie at 0.23 and the tie line scores 0.06. Improving any one line is worth about four times as much as improving the tie.
How it's worked out
The network's reliability is worked out exactly, with a decision diagram built link by link, so a network with many paths costs no more than one with few. A very large network is simulated instead (20,000 networks, with a fixed seed so the figures repeat), and the sentence says so.
The Fault tree, Design and Targets tabs are for block diagrams. On a network they point you back to the Calculator.
Where to go next
For directed systems with redundancy, voting or repair, see build a reliability block diagram. To check what a redundant system really gains when its parts share a cause, see common-cause groups.
The analysis comes from RePyability, an open-source Python library, whose documentation covers its analyses in code.