Model a one-shot device (reliability per demand)
Before you start: How many times the device was called on (demands) and how many times it failed, as one count or one row per batch.
Some equipment isn't judged by how long it runs, but by whether it works when called on. A relief valve must lift, a standby generator must start, a fire pump must run, an airbag must fire. For these the useful figure is the reliability per demand: the chance it works on any one demand.
The data are counts: how many demands, and how many failures. Reliafy turns them into a failure probability per demand with exact confidence bounds.
Enter the counts
Go to Modelling → Life models, press New model, choose Enter parameters and pick Per-demand (Binomial) from the distributions. Give the model a name.
Under Source, choose Enter counts and type the Demands and the Failures. If your counts come from several places (sites, lots, test campaigns), press + Add a batch for each and name them. The batches are pooled into one failure probability.
To read the counts from a file instead, choose From a dataset and pick a dataset with one row per batch, then its Demands column, Failures column and an optional Batch name.
Set the Confidence (%) for the bounds. The line under the form previews the answer as you type.
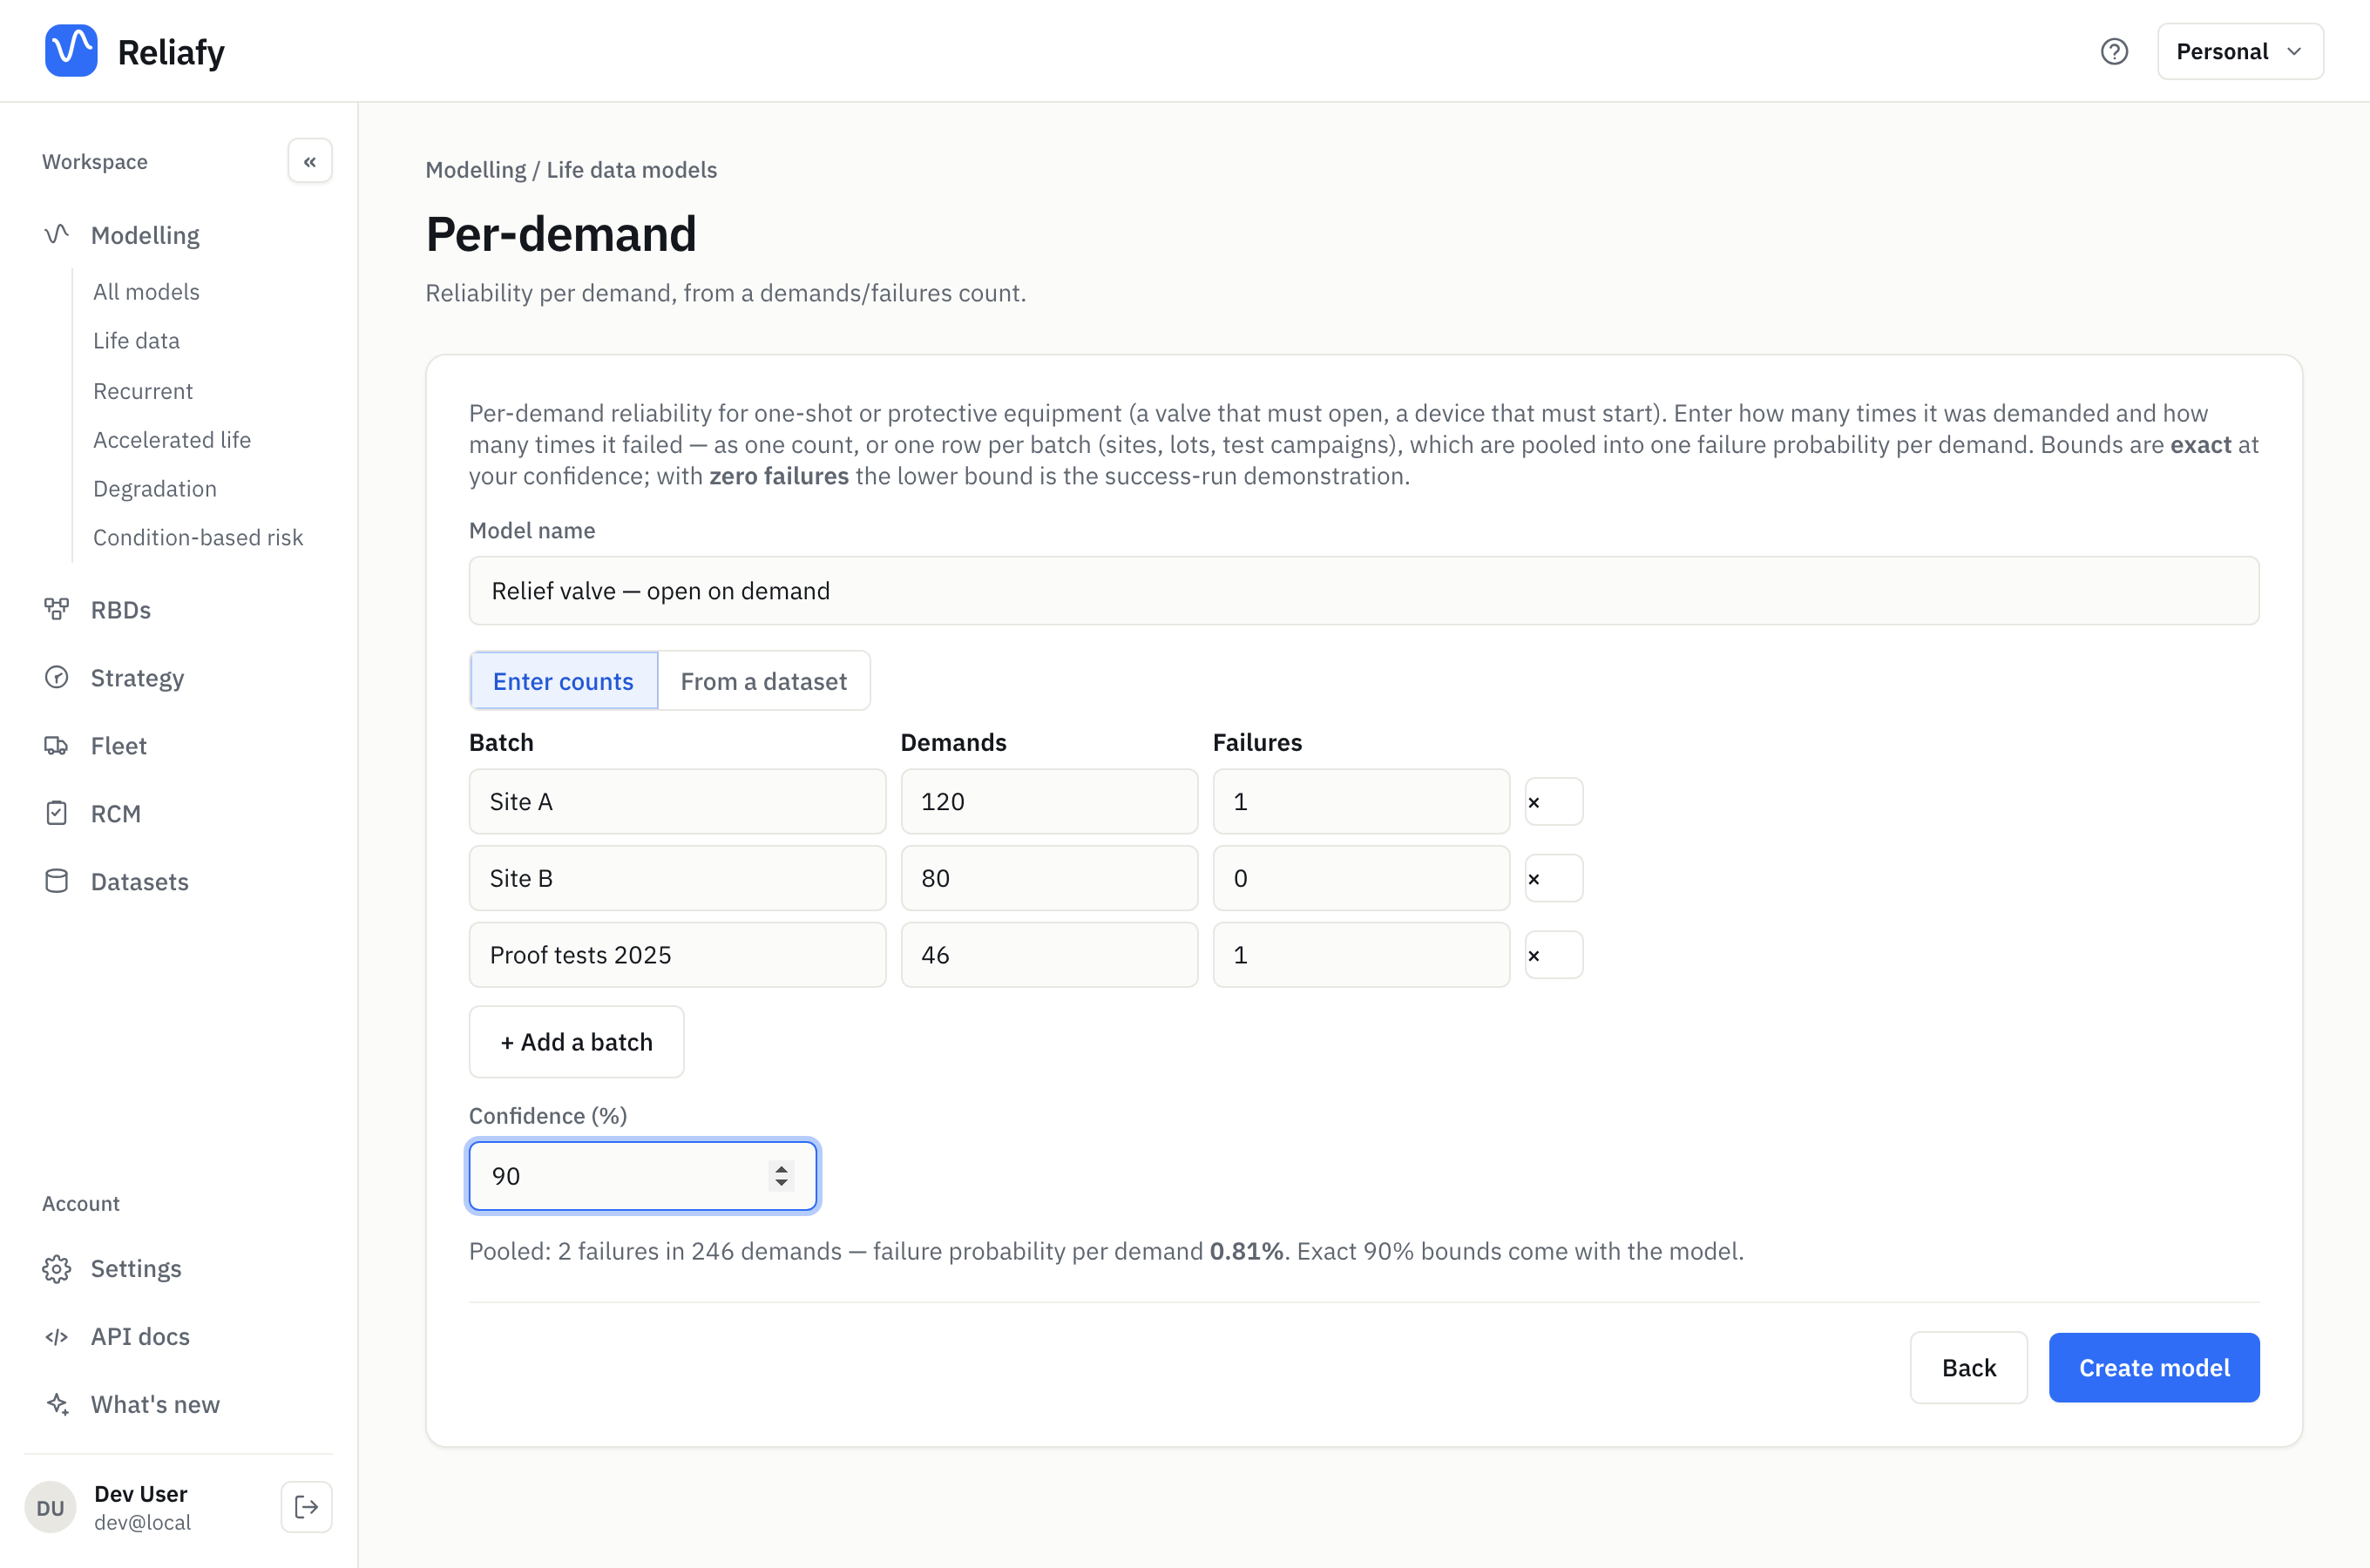
Press Create model.
Read the result
For a relief valve with three batches, 2 failures in 246 demands in all:
| Value | 90% interval | |
|---|---|---|
| Failure probability / demand | 0.81% | 0.14% to 2.54% |
| Reliability / demand | 99.2% | 97.5% to 99.9% |
| Reliability at 90% confidence (one-sided) | ≥ 97.9% |
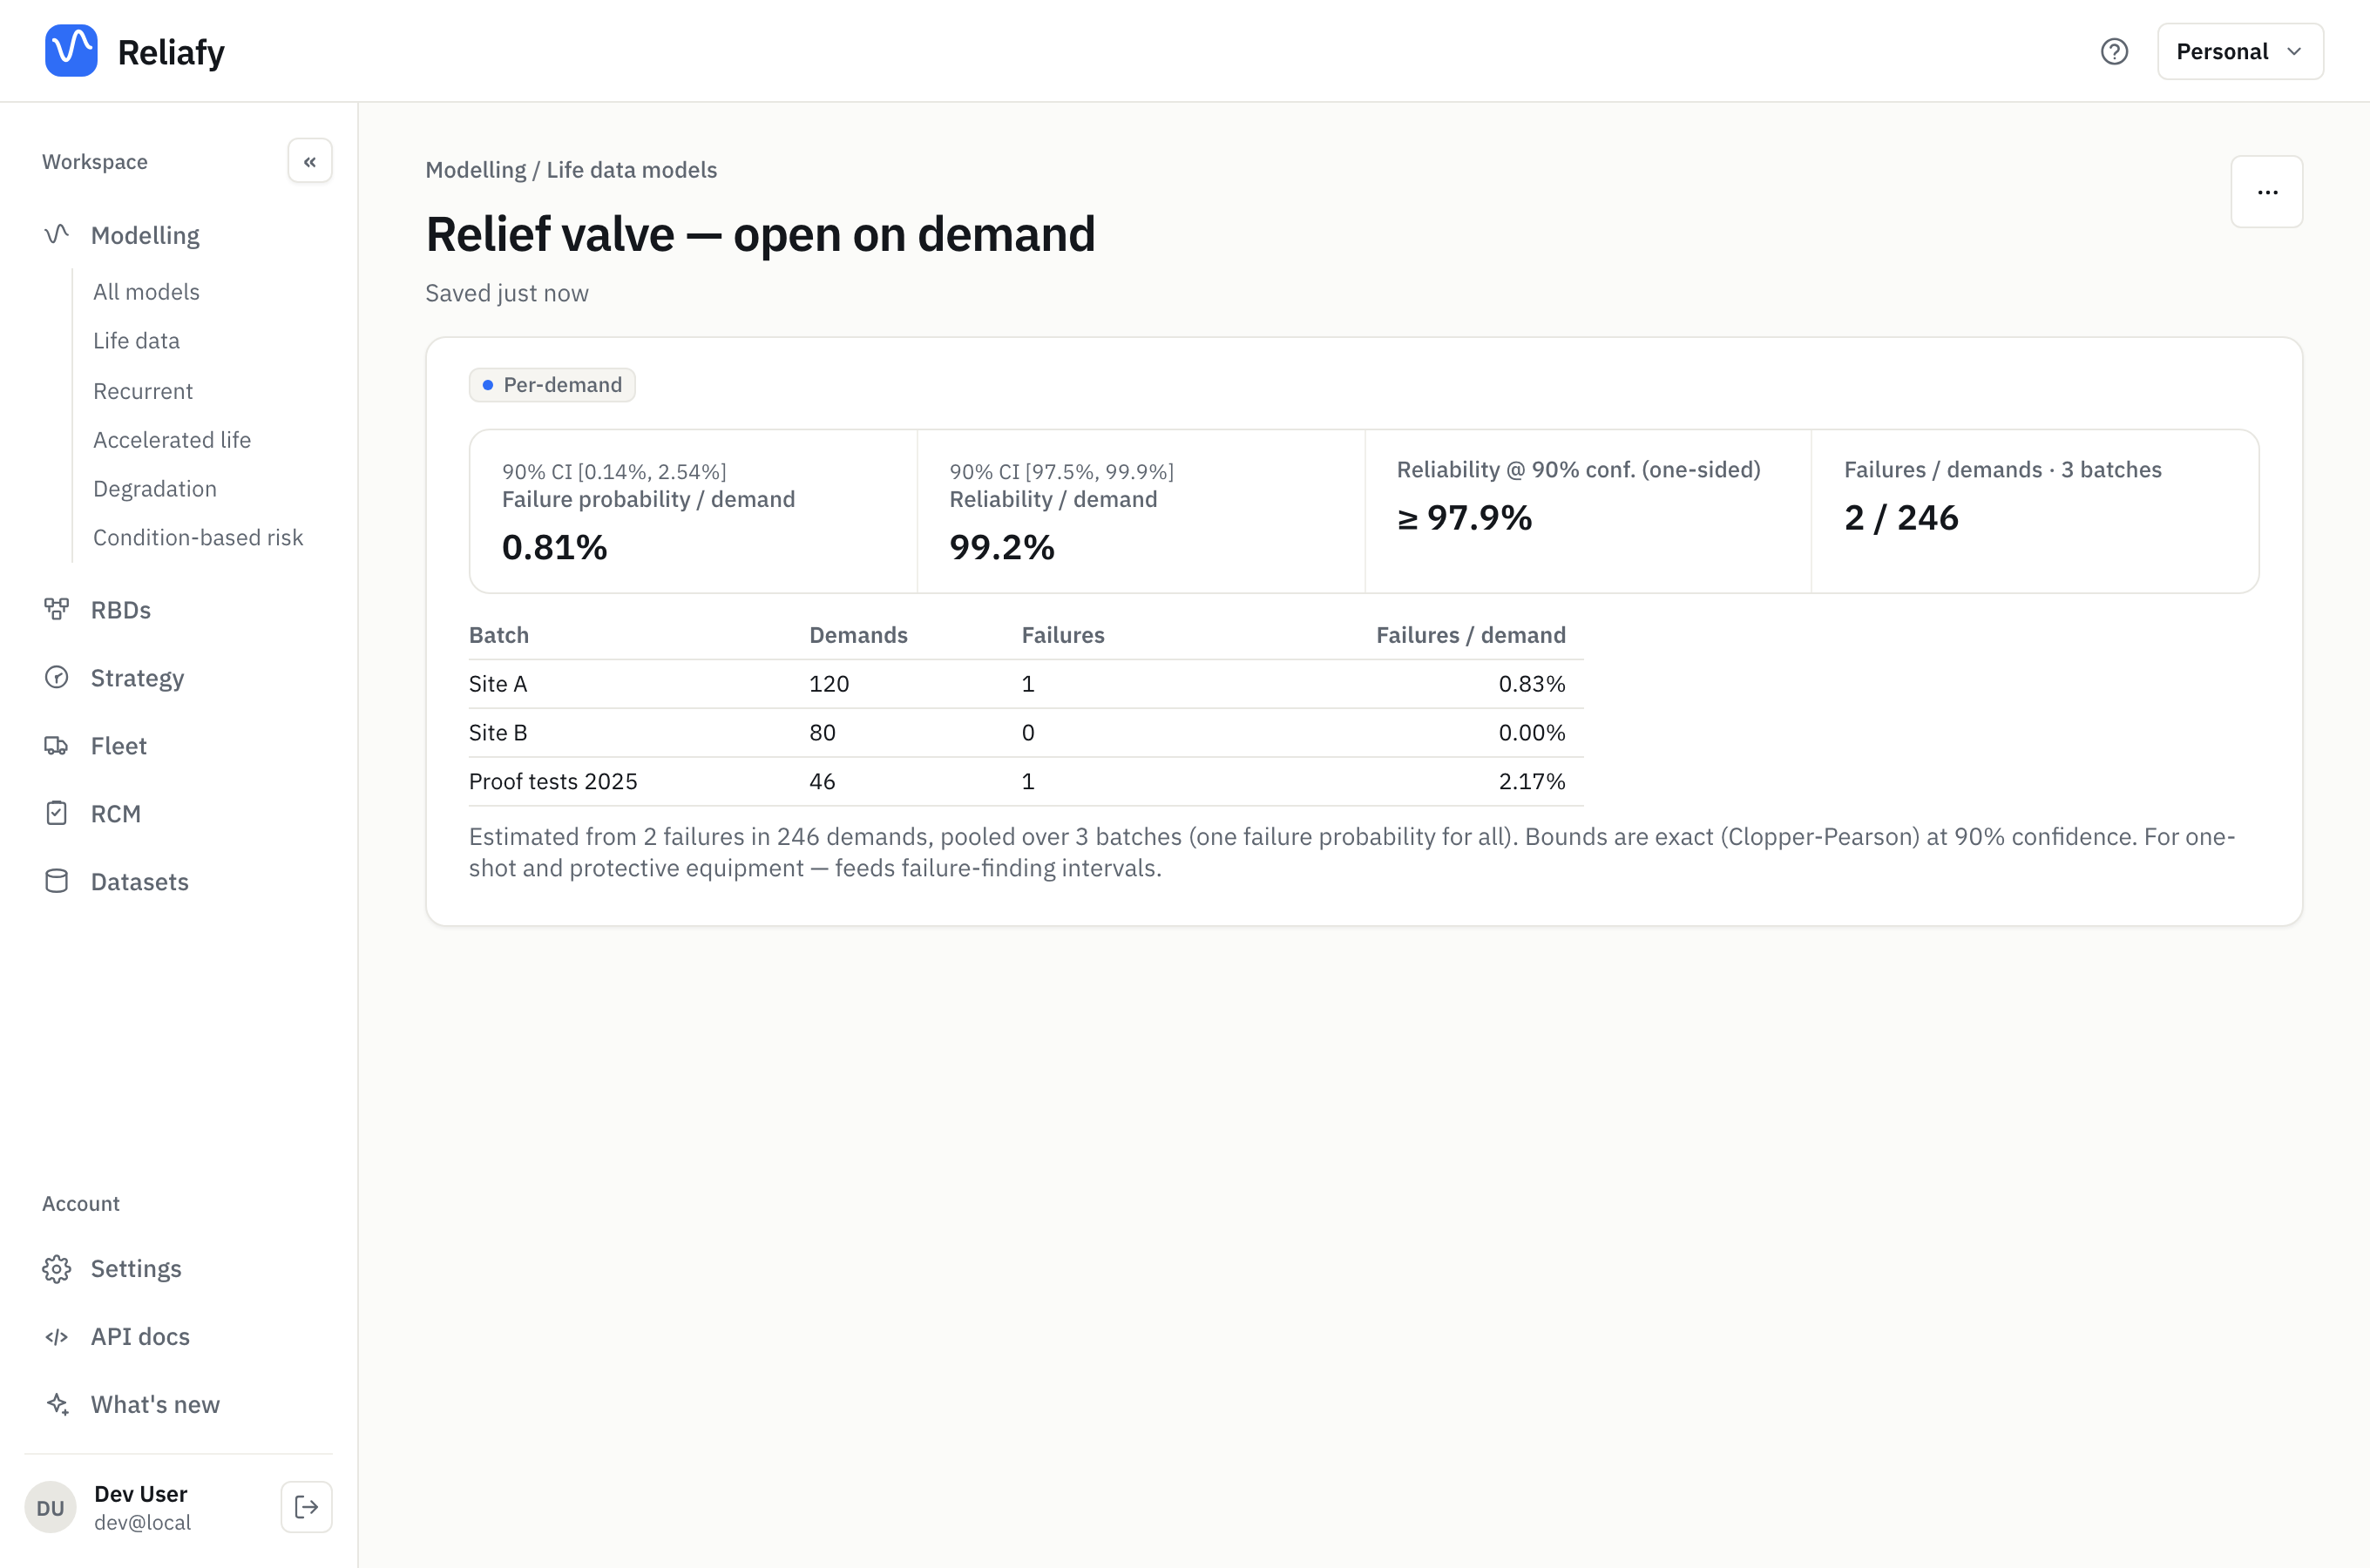
The one-sided figure is the one to quote against a requirement: "we're 90% sure the valve opens on at least 97.9% of demands". The table lists each batch's own rate, so a batch far from the pooled figure stands out. Here the 2025 proof tests (1 in 46) run worse than site B (0 in 80), but with so few failures that isn't yet evidence of a real difference.
Zero failures
With no failures at all, the estimate is 0%, which isn't useful on its own. The lower bound is: it's the success run demonstration. n demands with no failure show, at confidence C, that
R ≥ (1 − C)^(1/n)
So 45 successful demands show R ≥ 95% at 90% confidence, and 230 show R ≥ 99%. The form says it as you type: Success run — 45 demands, zero failures demonstrates reliability ≥ 95.0% at 90% confidence.
How the bounds work
Each demand is a yes-or-no trial with the same chance of failure, so the count of failures follows a binomial distribution. The bounds are exact (Clopper-Pearson), not an approximation, so they stay honest with the handful of failures one-shot devices usually have. That also means they are conservative: the true coverage is at least the confidence you asked for.
Pooling assumes every batch shares one failure probability. If the batches come from genuinely different designs or duties, model them separately.
Where to go next
- A protective device that fails while idle and is only found at a proof test needs a test interval rather than a per-demand figure: see verify a safety function and Strategy → Failure finding.
- To plan how many demands a test needs to show a reliability, see check a requirement and plan a test.