Set a system target and design to meet it
Before you start: A diagram whose blocks all have life models (and, for a repairable one, repair times).
A requirement is usually written for the whole system: "99% reliable over a 500-hour mission", or "99.9% available". The diagram tells you whether the design meets it. Two tabs then tell you how to close the gap:
- Targets splits the system target into a target for each block. It answers "what must each part achieve?", which is what you hand to a supplier or a maintenance team.
- Design changes the structure instead. It works out how many copies of each block to fit: the most reliable design for a budget, or the cheapest one that reaches the target.
Both are exact and work on the diagram as it stands, saved or not. This guide uses a cooling-water train: a controller, a pair of duty pumps and a heat exchanger, in series.
Give each block a target (Targets tab)
Open the diagram from RBDs and choose the Targets tab. Enter the Target reliability (%) and the Mission time, pick a Method and press Allocate.
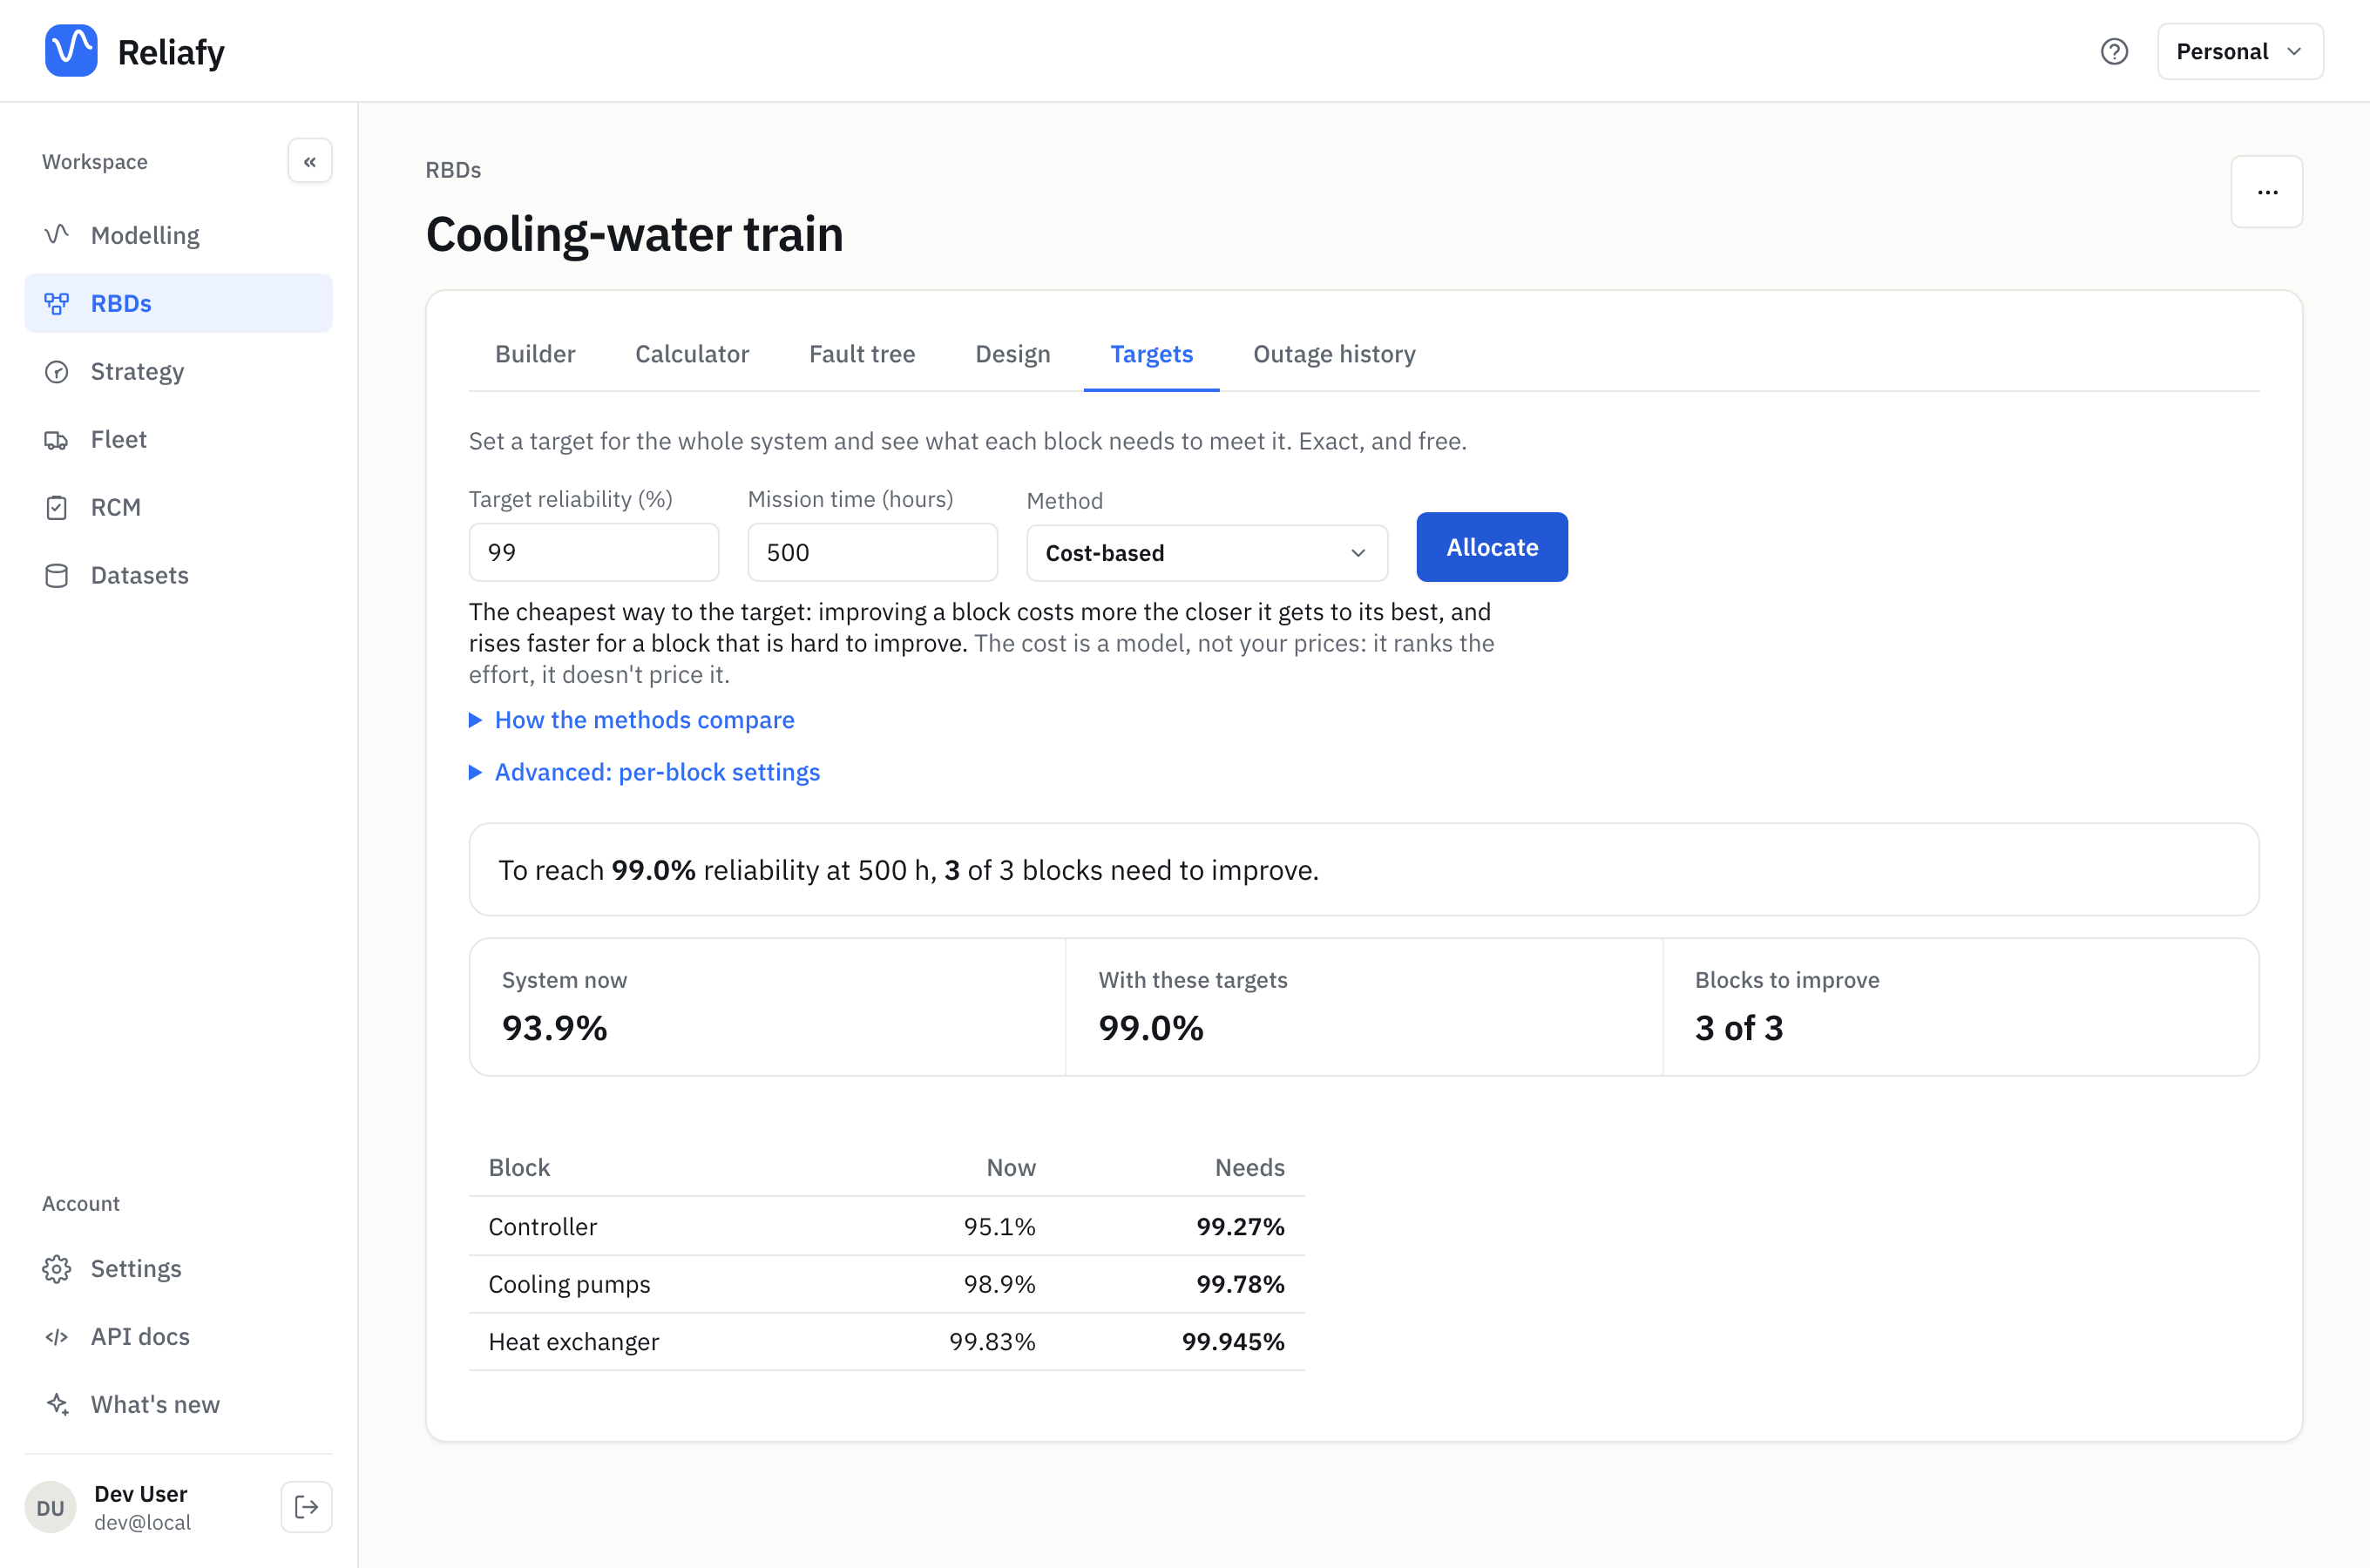
For the train, a 99% target at 500 hours needs all three blocks to improve. The system is at 93.9% today. The controller has to go from 95.1% to 99.27%, the pump pair from 98.9% to 99.78% and the heat exchanger from 99.83% to 99.945%. Meet those and the system meets 99.0%.
The method decides how the improvement is shared out. How the methods compare under the form explains each one; in short:
- Cost-based (the default) finds the cheapest way to the target. Making a block better costs more the closer it gets to perfect, and more again for a block that is hard to improve. It ranks the effort; it doesn't use your prices.
- Improvement cuts every block's chance of failing by the same factor. It suits an existing design you want to lift evenly.
- Minimum effort raises only the weakest blocks, to one common level. It works on series systems only.
- Simple (weighted) starts from the diagram alone, before you have block data. A weight makes a block take more or less of the change.
- Equal gives every block the same reliability: a quick first budget.
Advanced: per-block settings lets you Fix a block you can't change (a bought-in unit, say), give it a weight, cap how good it can get (Best (%)) or say how easily it improves (Feasibility, 0 to 0.99). Which columns appear depends on the method.
If the target can't be reached that way, the answer says so and gives the range the system can reach, with a link to try the highest.
A repairable diagram: availability targets
On a repairable diagram the target is an availability, and there is no mission time. The Availability method gives each block the availability it needs, and then the two ways to get there: a longer Mean life at today's repair time, or a shorter Repair time at today's mean life. Any pair in the same ratio works too. Mean life and repair time instead finds the cheapest pair of the two for each block; Change lets you move only one of them.
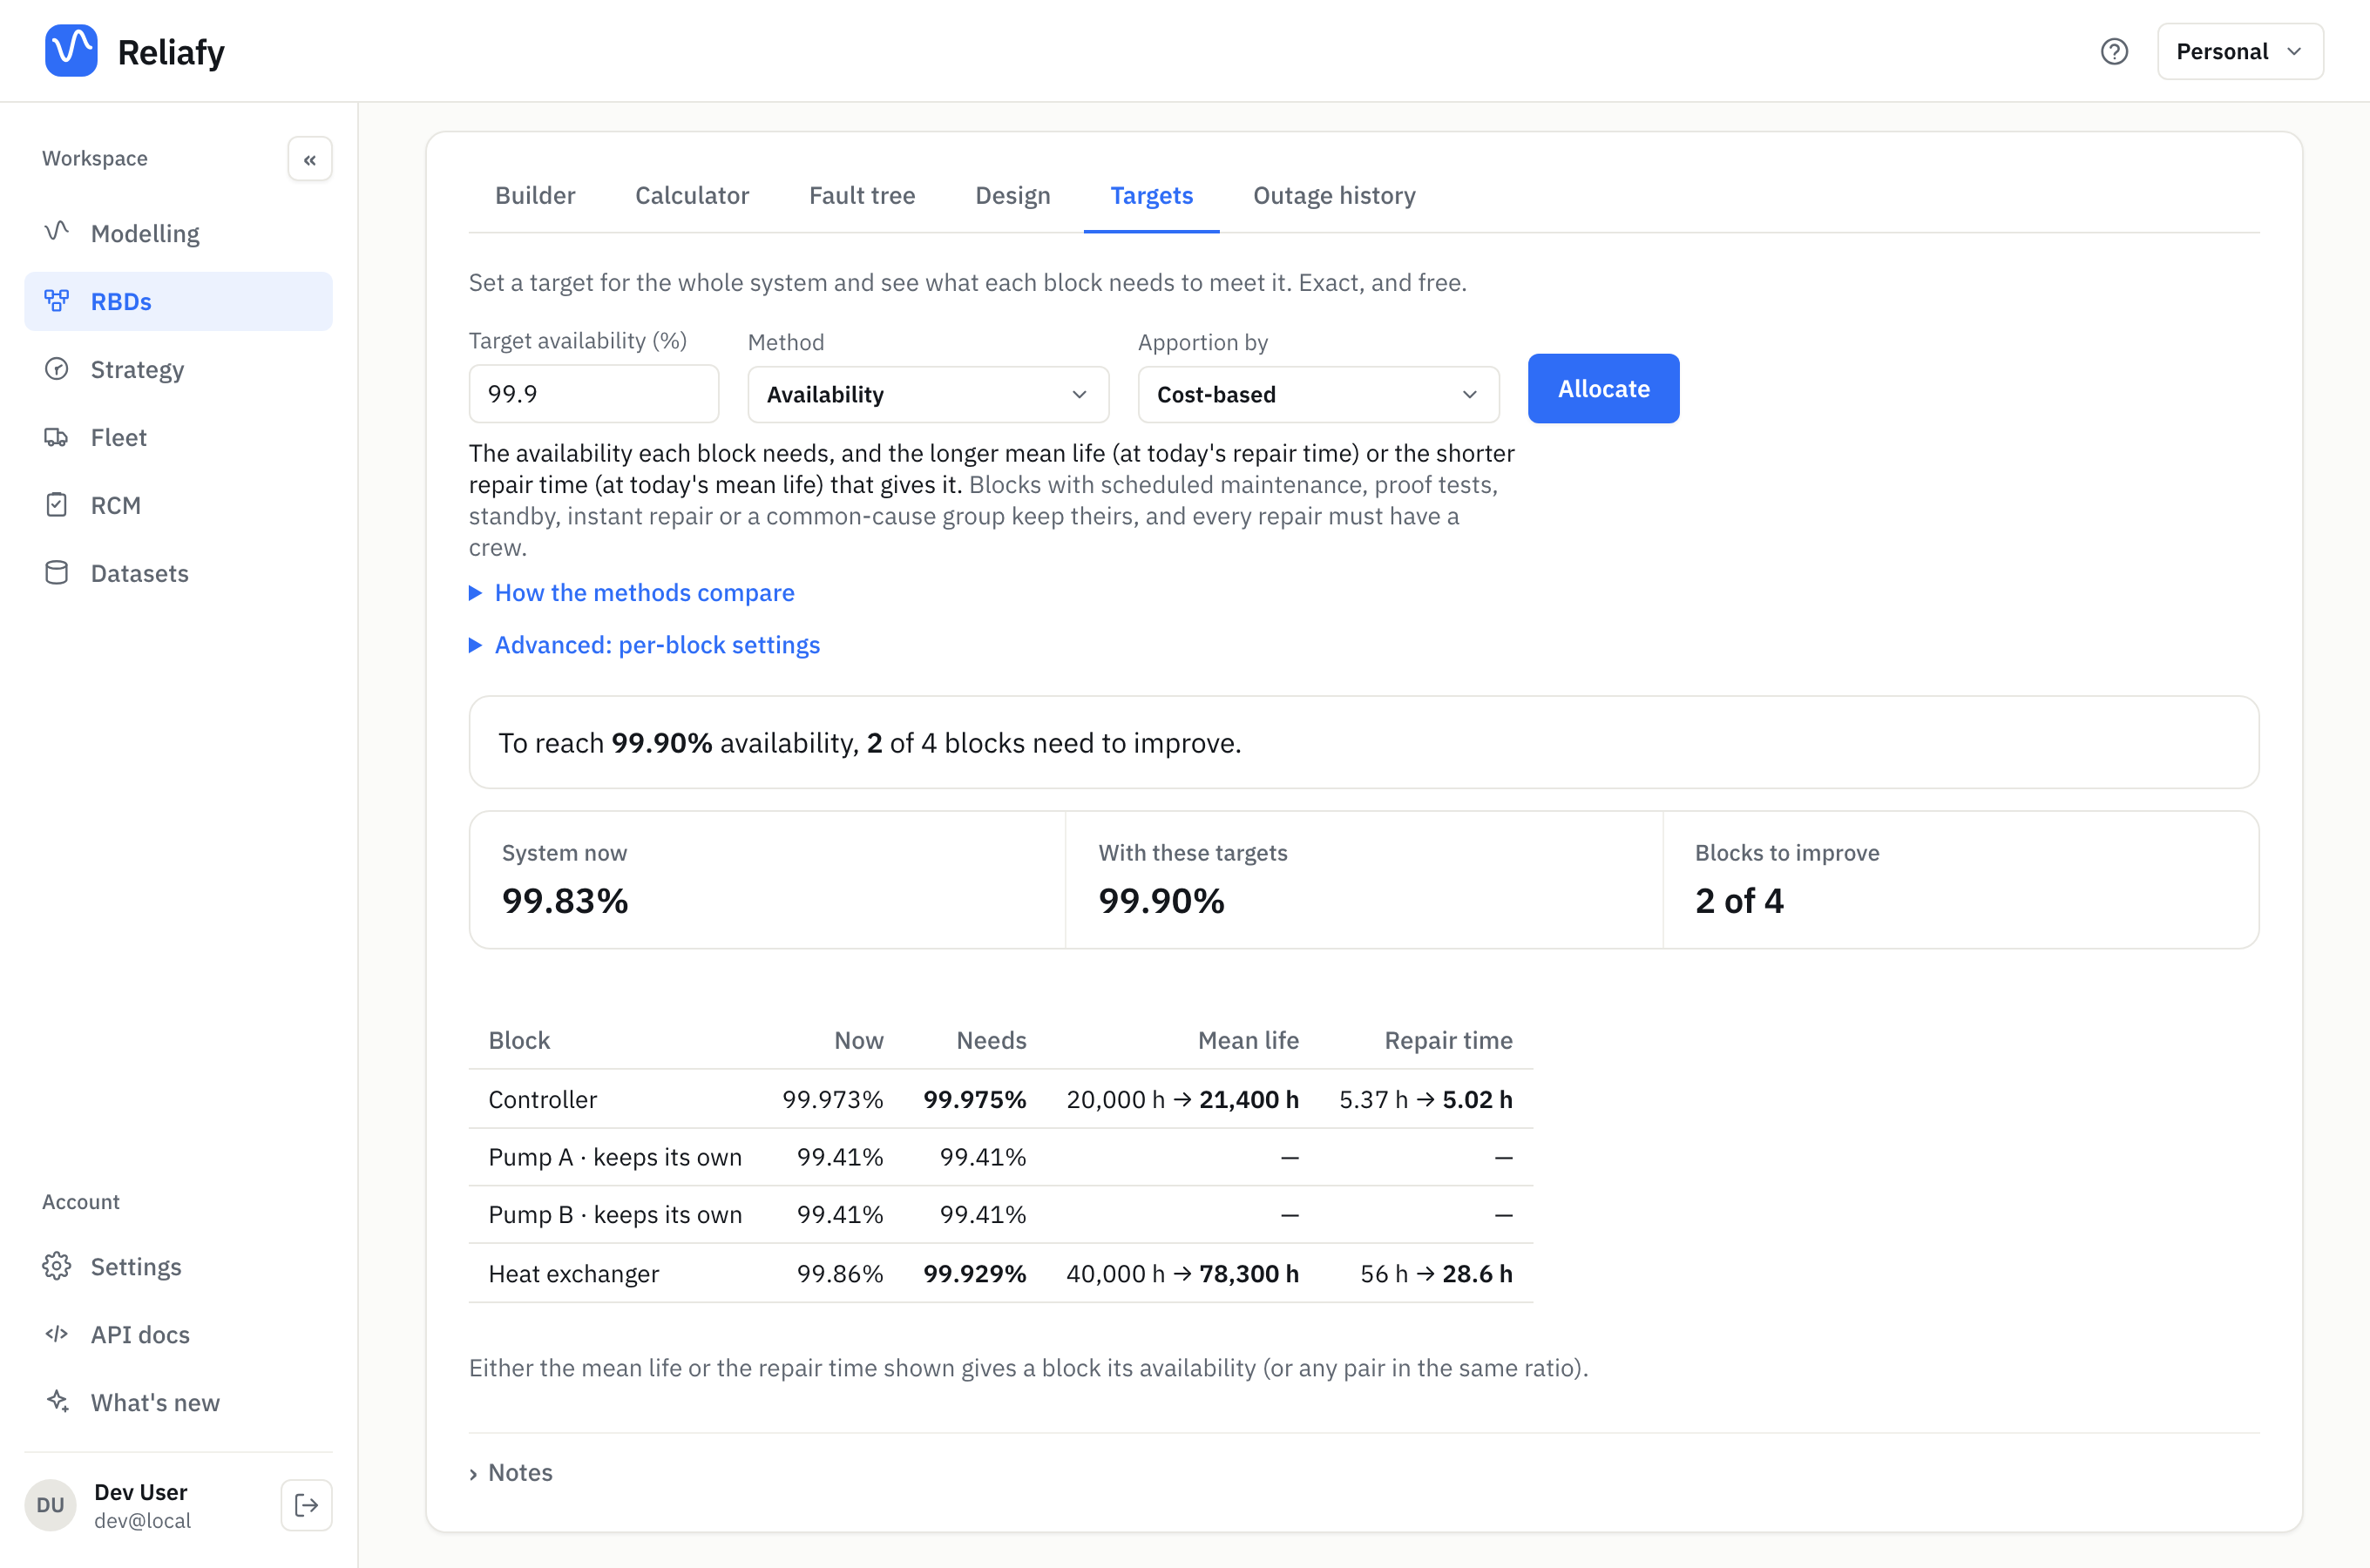
In the repairable train, a 99.9% target needs two blocks to improve. The heat exchanger needs 99.929%: a mean life of 78,300 hours instead of 40,000, or a repair time of 28.6 hours instead of 56. The pumps are marked keeps its own: blocks with scheduled maintenance, proof tests, standby, instant repair or a common-cause group keep their figures, because a single mean life and repair time can't describe them.
Add redundancy where it pays (Design tab)
Targets assumes the structure stays as drawn. Often the cheaper answer is a second unit. On a non-repairable diagram the Design tab works this out.
- Set the Mission time.
- Choose a Goal: Most reliable within a budget (and a Cost budget), or Cheapest to reach a target (and a Target R(t), as a fraction such as 0.99).
- In the table, give each block its Unit cost, the Max copies to consider and how many copies Must work (2 for a 2-out-of-3). Redundancy chooses Active copies, Cold standby (with the chance the switch-over works) or Best of both. Untick a block to leave it as drawn. Tick Weight or Volume to add those limits.
- Press Find design.
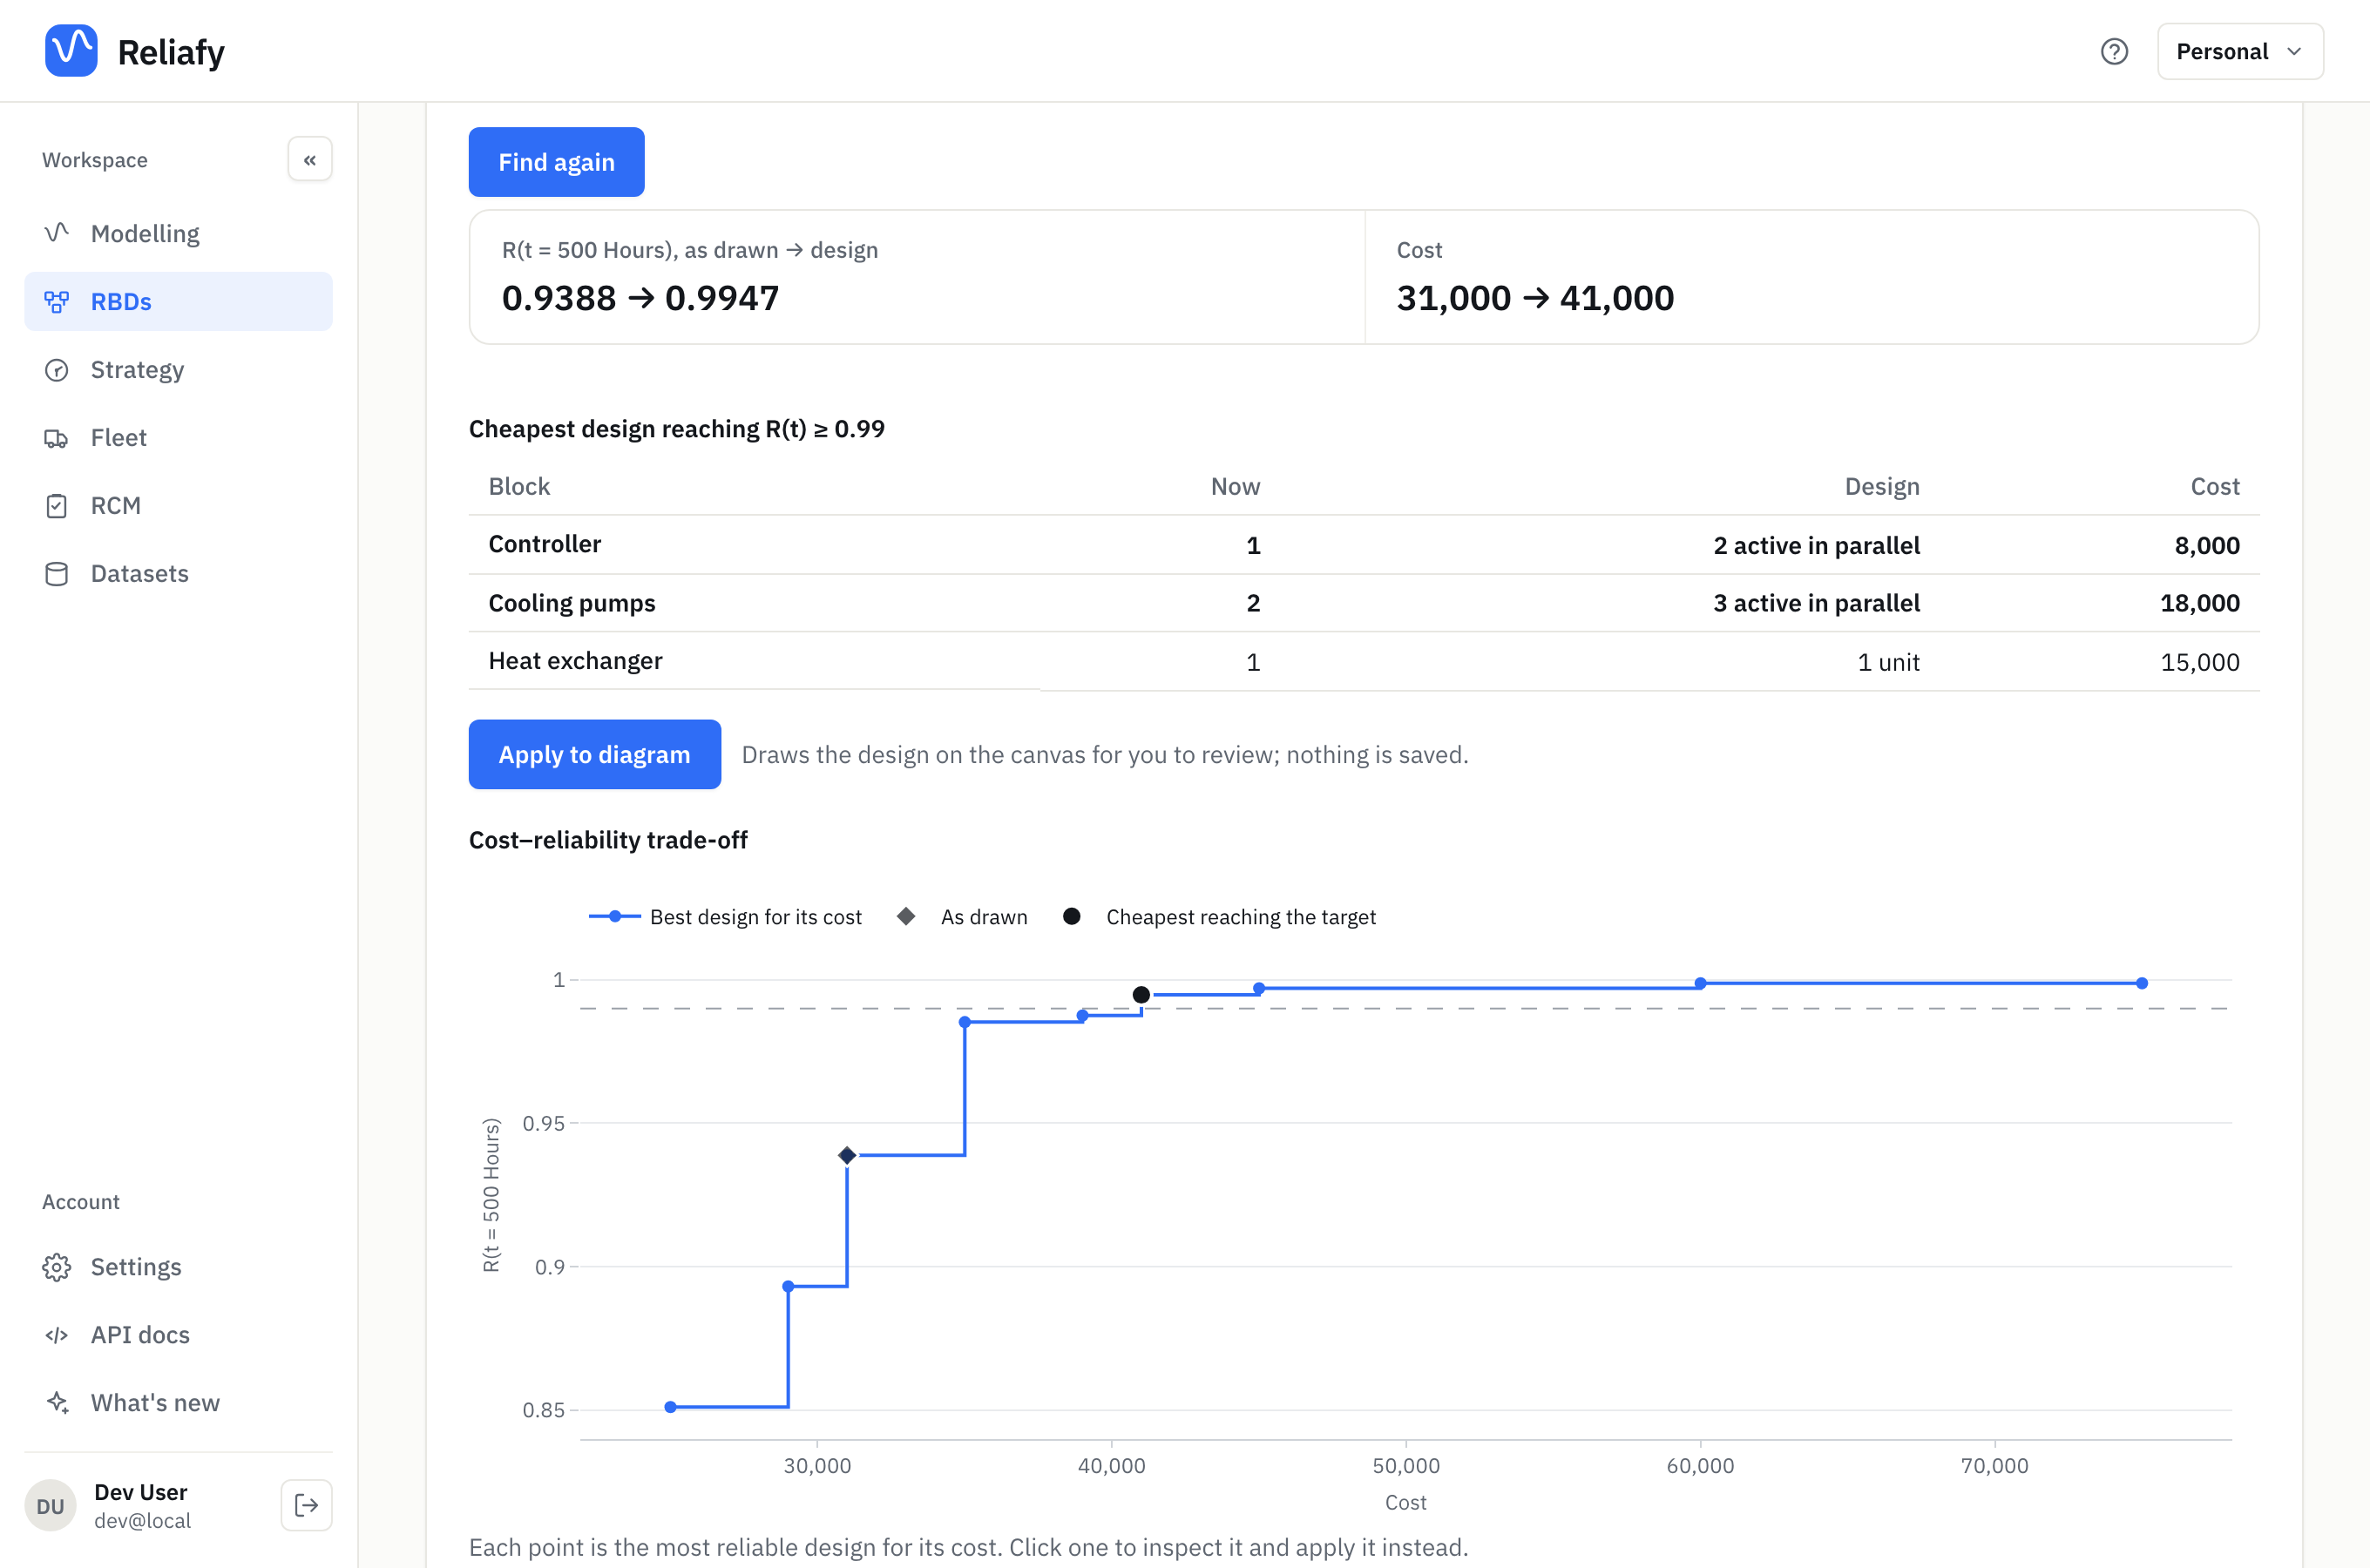
With unit costs of 4,000 for the controller, 6,000 for a pump and 15,000 for the heat exchanger, the cheapest design that reaches 0.99 adds a second controller and a third pump. Reliability at 500 hours goes from 0.9388 to 0.9947, and the cost from 31,000 to 41,000. The heat exchanger is already good enough on its own.
The Cost–reliability trade-off chart shows the most reliable design for every cost. The diamond is the design as drawn. Click any point to inspect that design instead. It is often worth paying a little more for a big step up, or saving a lot for a small step down.
+ type adds an alternative model for a block, such as a dearer but longer-lived pump. With Mix types within a block ticked, a block's copies can be of different types.
Press Apply to diagram to draw the design on the canvas. Nothing is saved: review it on the Builder tab, then Save to keep it, or Undo.
Only single components and parallel blocks of identical units can be given copies. The tab lists any other blocks (standby, k-out-of-n, sub-systems) as staying as drawn.
A repairable diagram: the cheapest design to own
On a repairable diagram, more copies cost more to buy but save downtime. The Design tab weighs the two over the time you own the system. It needs a Purchase price on at least one block (double-click it → Costs) and the System downtime cost (⋯ → Costs…). Set the Ownership horizon, an optional Minimum availability and Discount rate, and press Find the cheapest design. This part is in Pro.
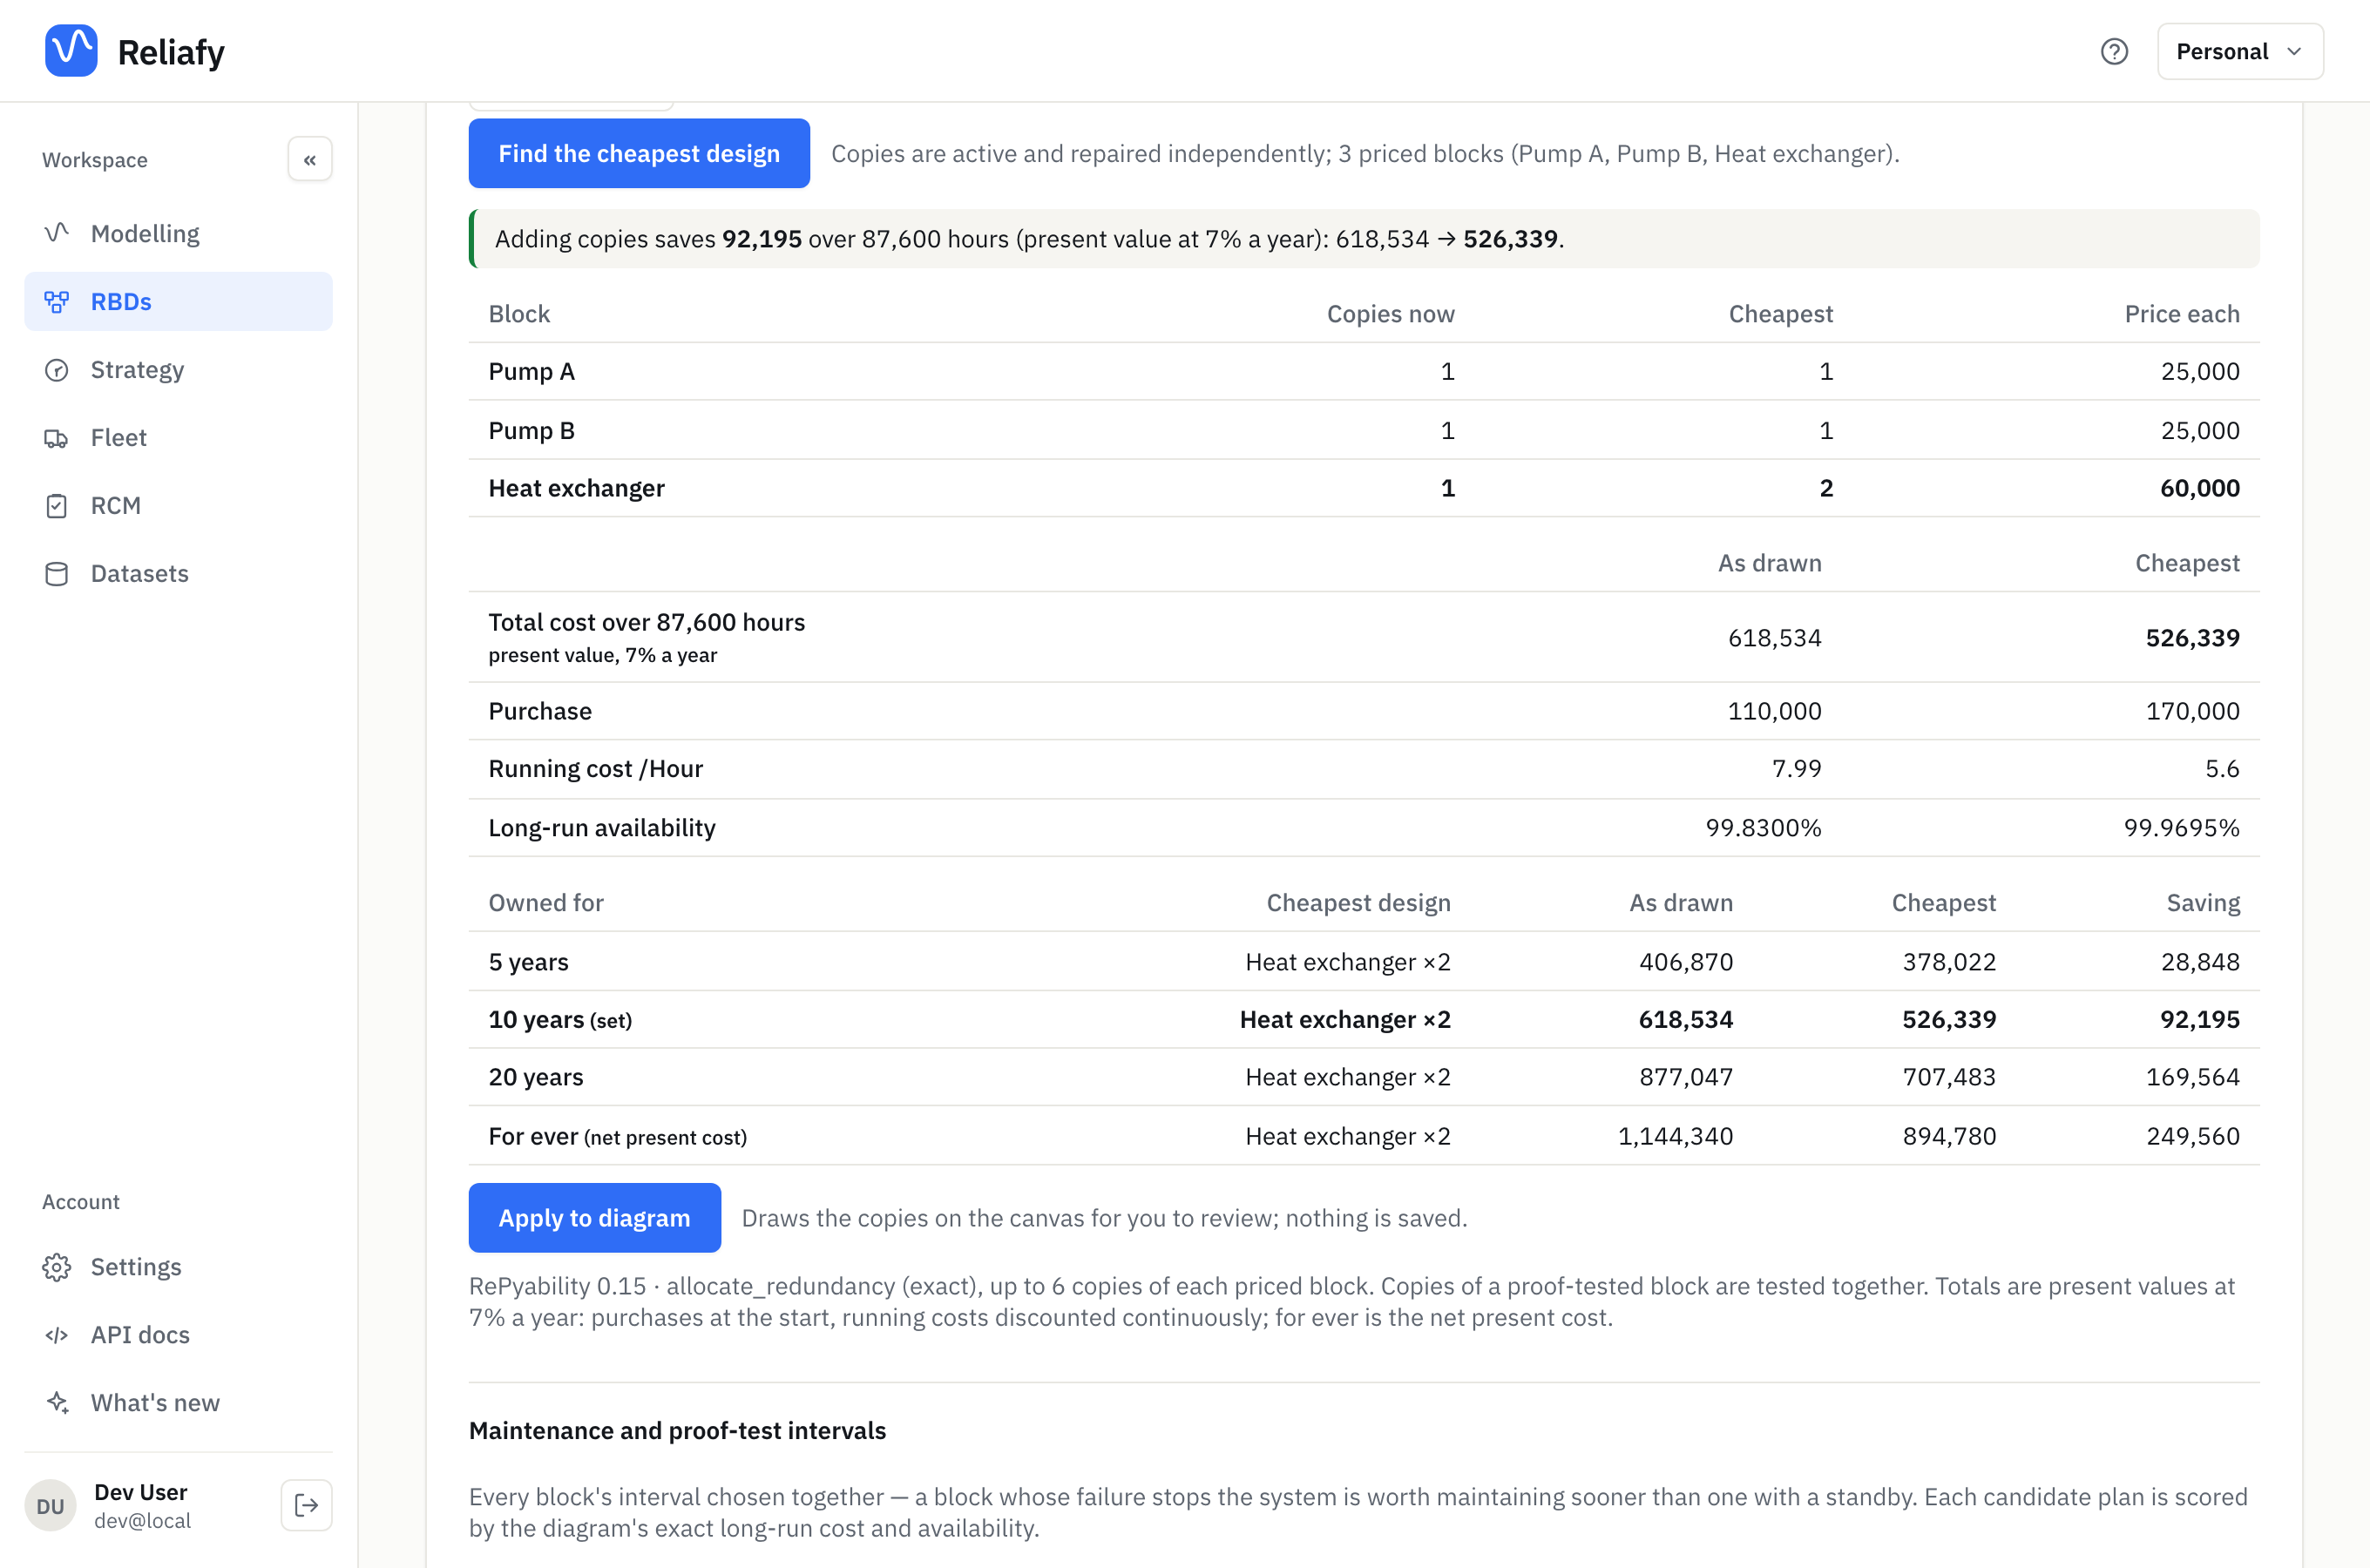
For the train, owned for 87,600 hours (10 years) at 7% a year, a second heat exchanger pays for itself. It costs 60,000 more to buy, but it lifts the availability from 99.83% to 99.97% and cuts the total cost of ownership from 618,534 to 526,339. The table under it repeats the choice for other horizons: here the answer is the same from 5 years to for ever.
Trains copy a whole chain at once, such as a pump with its valve and motor. Each copy is another path into the node the chain feeds. The costs behind these figures are in costs, intervals and what to improve.
How it works
The block targets come from the diagram's structure. The system's reliability is a function of its blocks' reliabilities, and each method is a different rule for choosing block values that give the target. Cost-based allocation minimises a total cost of improvement, where improving block i from Rᵢ towards its best costs more and more as it gets close. The design search scores every combination of copies exactly, up to the maximum you set. When there are too many combinations it uses a fast greedy search and says so.
Where to go next
- Build a reliability block diagram covers the diagram itself.
- Model system availability explains the availability figures behind the repairable targets.
- Costs, intervals and what to improve prices the downtime and chooses maintenance intervals on the same tab.