Kaplan–Meier, explained: the survival curve that counts every unit
The Kaplan–Meier curve is the fraction of units still running at each age, worked out straight from the data. It assumes no distribution. It drops only when a unit fails, and it counts every unit that hasn't failed for exactly as long as it was watched. That last part is why it exists: it is the simplest honest way to read life data when some units are still running.
Statisticians call it the Kaplan–Meier estimator, or the product-limit estimator. Medical researchers use it for patient survival; reliability engineers use it for pumps, seals and bearings. The arithmetic is the same.
A worked example: twelve pump seals
Twelve seals, months in service. Six failed. Six were still running when last seen: some are still in service, some were changed at an overhaul while still sealing. Those six are suspensions (right-censored): each one lasted at least that long.
| Seal | Months | Status |
|---|---|---|
| 1 | 2 | failed |
| 2 | 4 | still running |
| 3 | 5 | failed |
| 4 | 7 | failed |
| 5 | 8 | still running |
| 6 | 9 | failed |
| 7 | 11 | still running |
| 8 | 12 | failed |
| 9 | 13 | still running |
| 10 | 15 | failed |
| 11 | 17 | still running |
| 12 | 20 | still running |
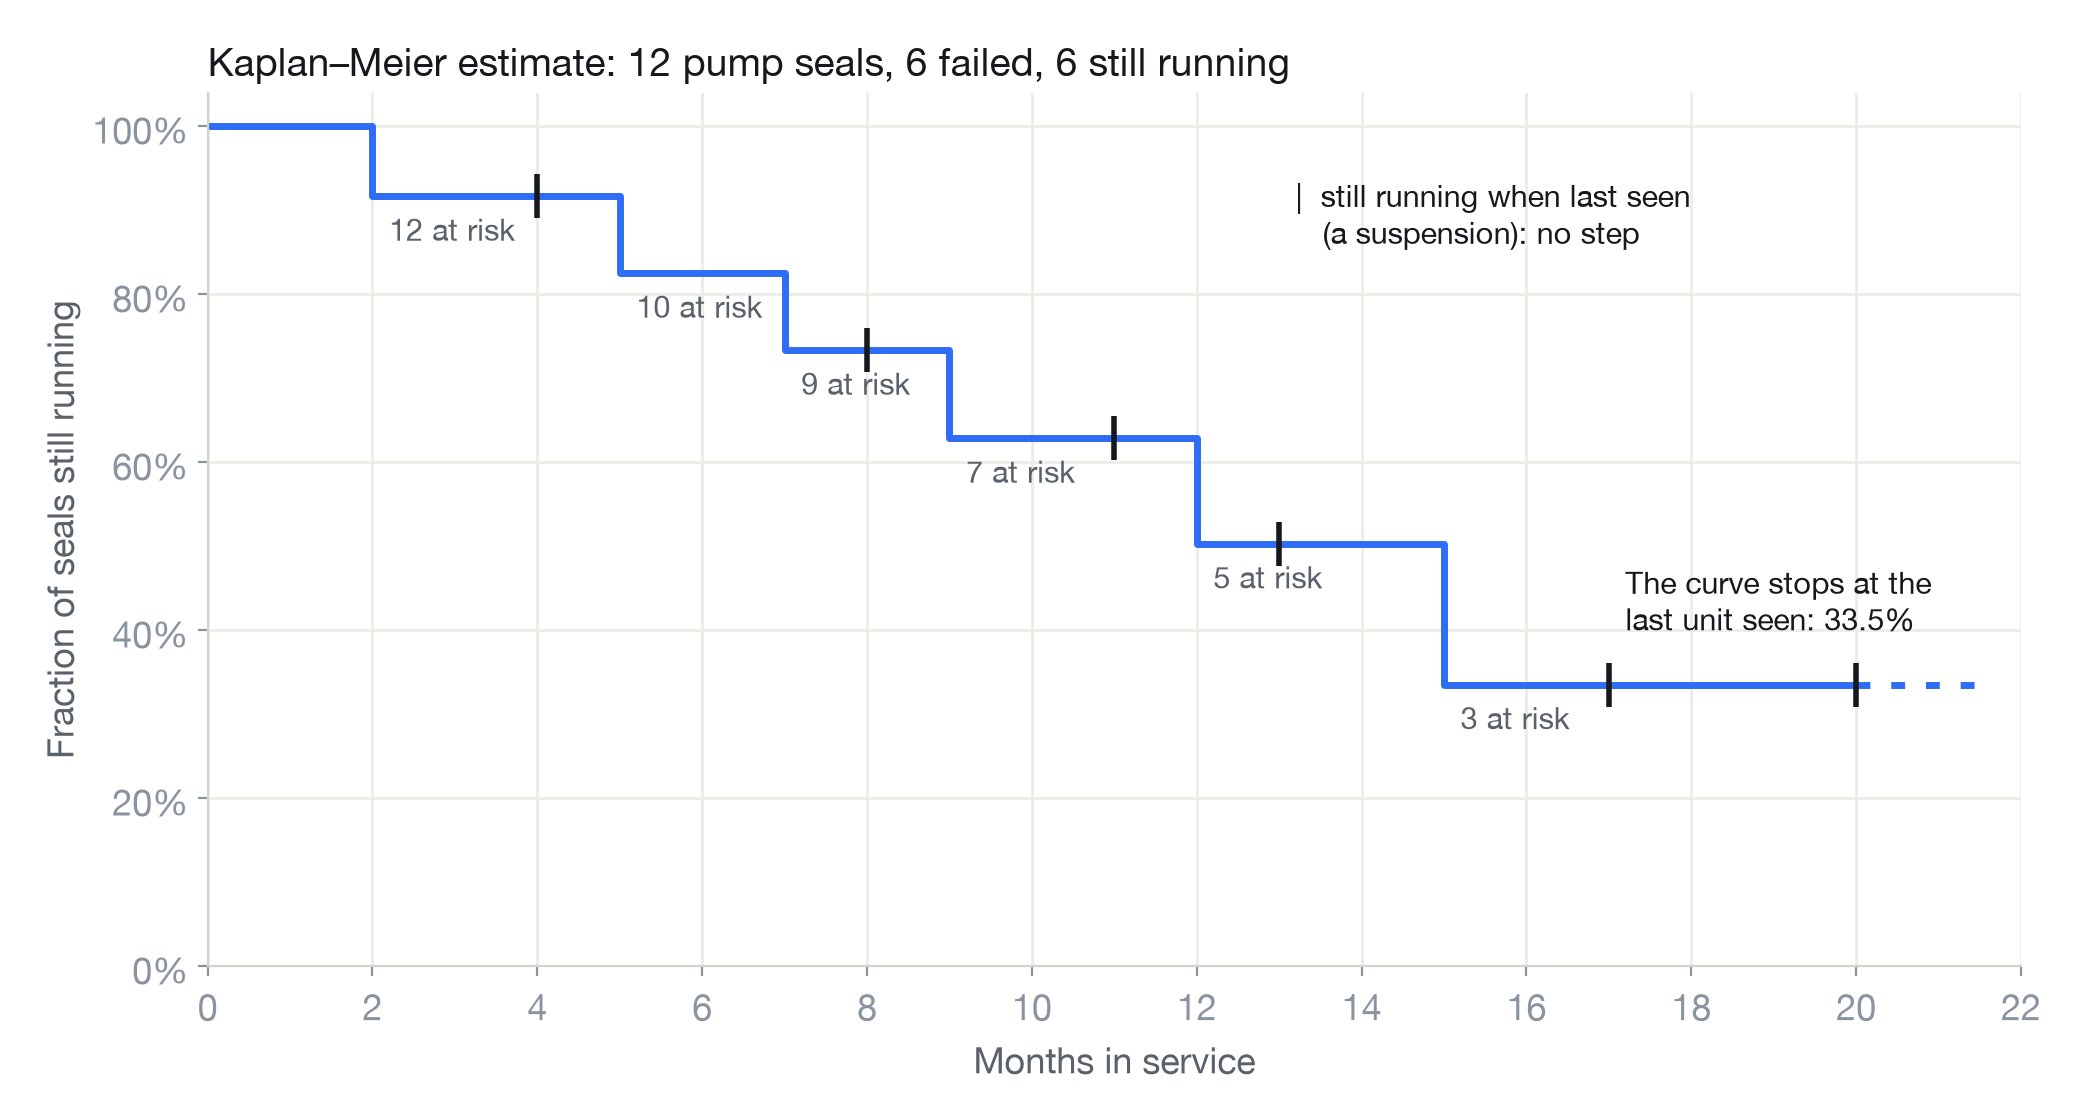
Build it one failure at a time
The idea in words: at each failure, ask what fraction of the seals still being watched got through it. Then multiply those fractions together as you go.
The seals still being watched just before a failure are the risk set: the ones that hadn't failed and hadn't yet left the data.
| Months | What happened | At risk | Got through | Still running |
|---|---|---|---|---|
| 2 | a seal fails | 12 | 11 of 12 | 91.7% |
| 4 | a seal leaves, still running | 91.7% | ||
| 5 | a seal fails | 10 | 9 of 10 | 82.5% |
| 7 | a seal fails | 9 | 8 of 9 | 73.3% |
| 8 | a seal leaves, still running | 73.3% | ||
| 9 | a seal fails | 7 | 6 of 7 | 62.9% |
| 11 | a seal leaves, still running | 62.9% | ||
| 12 | a seal fails | 5 | 4 of 5 | 50.3% |
| 13 | a seal leaves, still running | 50.3% | ||
| 15 | a seal fails | 3 | 2 of 3 | 33.5% |
| 17, 20 | two seals leave, still running | 33.5% |
So at 12 months, 91.7% × 9/10 × 8/9 × 6/7 × 4/5 = 50.3% of seals are estimated to still be running. The median life, where the curve first reaches 50% or below, is 15 months.
Why the curve steps
Between failures nothing new is learnt about how many seals fail, so the curve stays flat. At a failure it drops by the share of the risk set that failed. With twelve seals the steps are big; with a thousand they are small and the curve looks smooth. It never slopes, because the data never says a failure happened between two times.
A seal that leaves the data still running doesn't cause a step. It wasn't a failure. But it does leave the risk set, so every later step is a share of a smaller group. At 15 months only three seals are still being watched, so one failure takes the curve down by a third.
How suspensions change the answer
The seals still running are where most of the mistakes happen. At 12 months:
- Kaplan–Meier: 50.3% still running.
- Drop the six suspensions and work from the failures alone: five of the six failures came by 12 months, so 16.7%. Far too pessimistic: the strongest seals are the ones missing.
- Count the suspensions as failures: 33.3%. Also too pessimistic: it claims a seal failed the moment you stopped watching it.
- Divide by all twelve as if every seal was watched to 12 months: five failures, so 58.3%. Too optimistic: three seals left before 12 months, and some of them might have failed before then.
Kaplan–Meier sits between the last two because it uses each seal for exactly as long as it was seen, no more and no less. For more on why dropping suspensions biases life estimates, and by how much, see censored data and suspensions.
How sure is it?
Not very, with twelve seals. The 95% confidence bounds on the 50.3% at 12 months run from 17.5% to 76.2%. The curve is the best single estimate; the bounds say how much twelve units can tell you. They narrow as the risk set grows, and widen at the right of the curve, where few units are left.
Where the curve stops
The last seal seen was still running at 20 months, so the curve ends there, at 33.5%. Beyond 20 months it says nothing: the tail is unknown, not flat. For the same reason Kaplan–Meier can't give a mean life on its own when the last unit is a suspension. To predict past the data, or to feed a life into a replacement interval or a block diagram, fit a distribution such as a Weibull, and use the Kaplan–Meier curve to check the fit by eye.
The formula
In words. Multiply, over every failure time up to t, the fraction of the risk set that got through it.
In symbols. With failures at times ti, di failures at ti and ni units at risk just before it:
R̂(t) = ∏ti ≤ t (1 − di / ni)
Greenwood's formula gives the variance behind the confidence bounds:
Var[R̂(t)] ≈ R̂(t)² Σti ≤ t di / [ni(ni − di)]
Ties are handled by di: two failures at the same time make one step of 2/ni. A suspension at the same time as a failure is counted in that failure's risk set, by convention: it was still running when the failure happened.
Kaplan–Meier in Reliafy and SurPyval
In Reliafy, the non-parametric estimators sit beside the distributions when you fit a model, and Compare groups draws a Kaplan–Meier curve for each group, with the log-rank test of whether they differ. The non-parametric reference covers Kaplan–Meier and its relatives (Nelson–Aalen, Fleming–Harrington, Turnbull for interval data).
Every number on this page comes from SurPyval, the open-source survival statistics library under Reliafy:
import surpyval as sv

months = [2, 4, 5, 7, 8, 9, 11, 12, 13, 15, 17, 20]
status = [0, 1, 0, 0, 1, 0, 1, 0, 1, 0, 1, 1]  # 0 = failed, 1 = still running

km = sv.KaplanMeier.fit(x=months, c=status)
km.sf(12)                                   # 0.503
km.R_cb(12, bound="two-sided", alpha_ci=0.05)  # [0.762, 0.175]
Frequently asked questions
What does a Kaplan–Meier curve show?
The estimated fraction of units still running (not yet failed) at each age, from the data alone. It steps down at each failure and stays flat between them. Units still running are counted for as long as they were watched.
Why does the Kaplan–Meier curve have steps?
Because it only changes when the data shows a failure. Between failures there is no new information about failures, so it stays flat; at each failure it drops by the share of units at risk that failed.
What is the risk set?
The units still being watched just before a failure: those that haven't failed and haven't left the data. Each step is the number that failed divided by the risk set. A unit that leaves while still running shrinks the risk set for every later failure, but causes no step itself.
How is Kaplan–Meier different from fitting a Weibull?
Kaplan–Meier assumes no shape and can't go beyond the last unit seen. A Weibull assumes a shape, gives parameters, and can predict past the data. Use Kaplan–Meier to see what the data says and to check a fit; use a distribution to predict, set intervals or build system models.
Kaplan–Meier or Nelson–Aalen?
Nelson–Aalen estimates the cumulative hazard and converts it to survival. It is often steadier in small samples. For the seals, it gives 52.9% at 12 months against Kaplan–Meier's 50.3%. The two agree as samples grow; a big gap between them is a sign of thin data.