Get the chance a system lasts from the equipment you have today
Before you start: A reliability block diagram with a life model on each block, and the age of each part (or a diagram built from your asset tree, which reads them).
The usual RBD answer is for new equipment: every block starts at age zero. That is the design figure. It is rarely the question an operations manager asks. The question is: with the pump we have, which has run 3,000 hours, and the one we fitted last week, what is the chance the station lasts the next 1,000?
Ticking As of now answers that one. It gives each block its age today and runs the results from now.
Why age matters, in words
A part that wears out (a bearing, a seal, a belt) is more likely to fail in the next 1,000 hours when it has run 3,000 than when it is new. So an old pump weakens the system more than a new one does. A part with a constant failure rate does not age: an exponential model forgets its past, so its age changes nothing. That is why only some blocks move when you set ages, and the wear-out ones move most.
The calculation behind it is a conditional one: given that the block has survived to its age, what is the chance it survives a further 1,000 hours?
Tick As of now
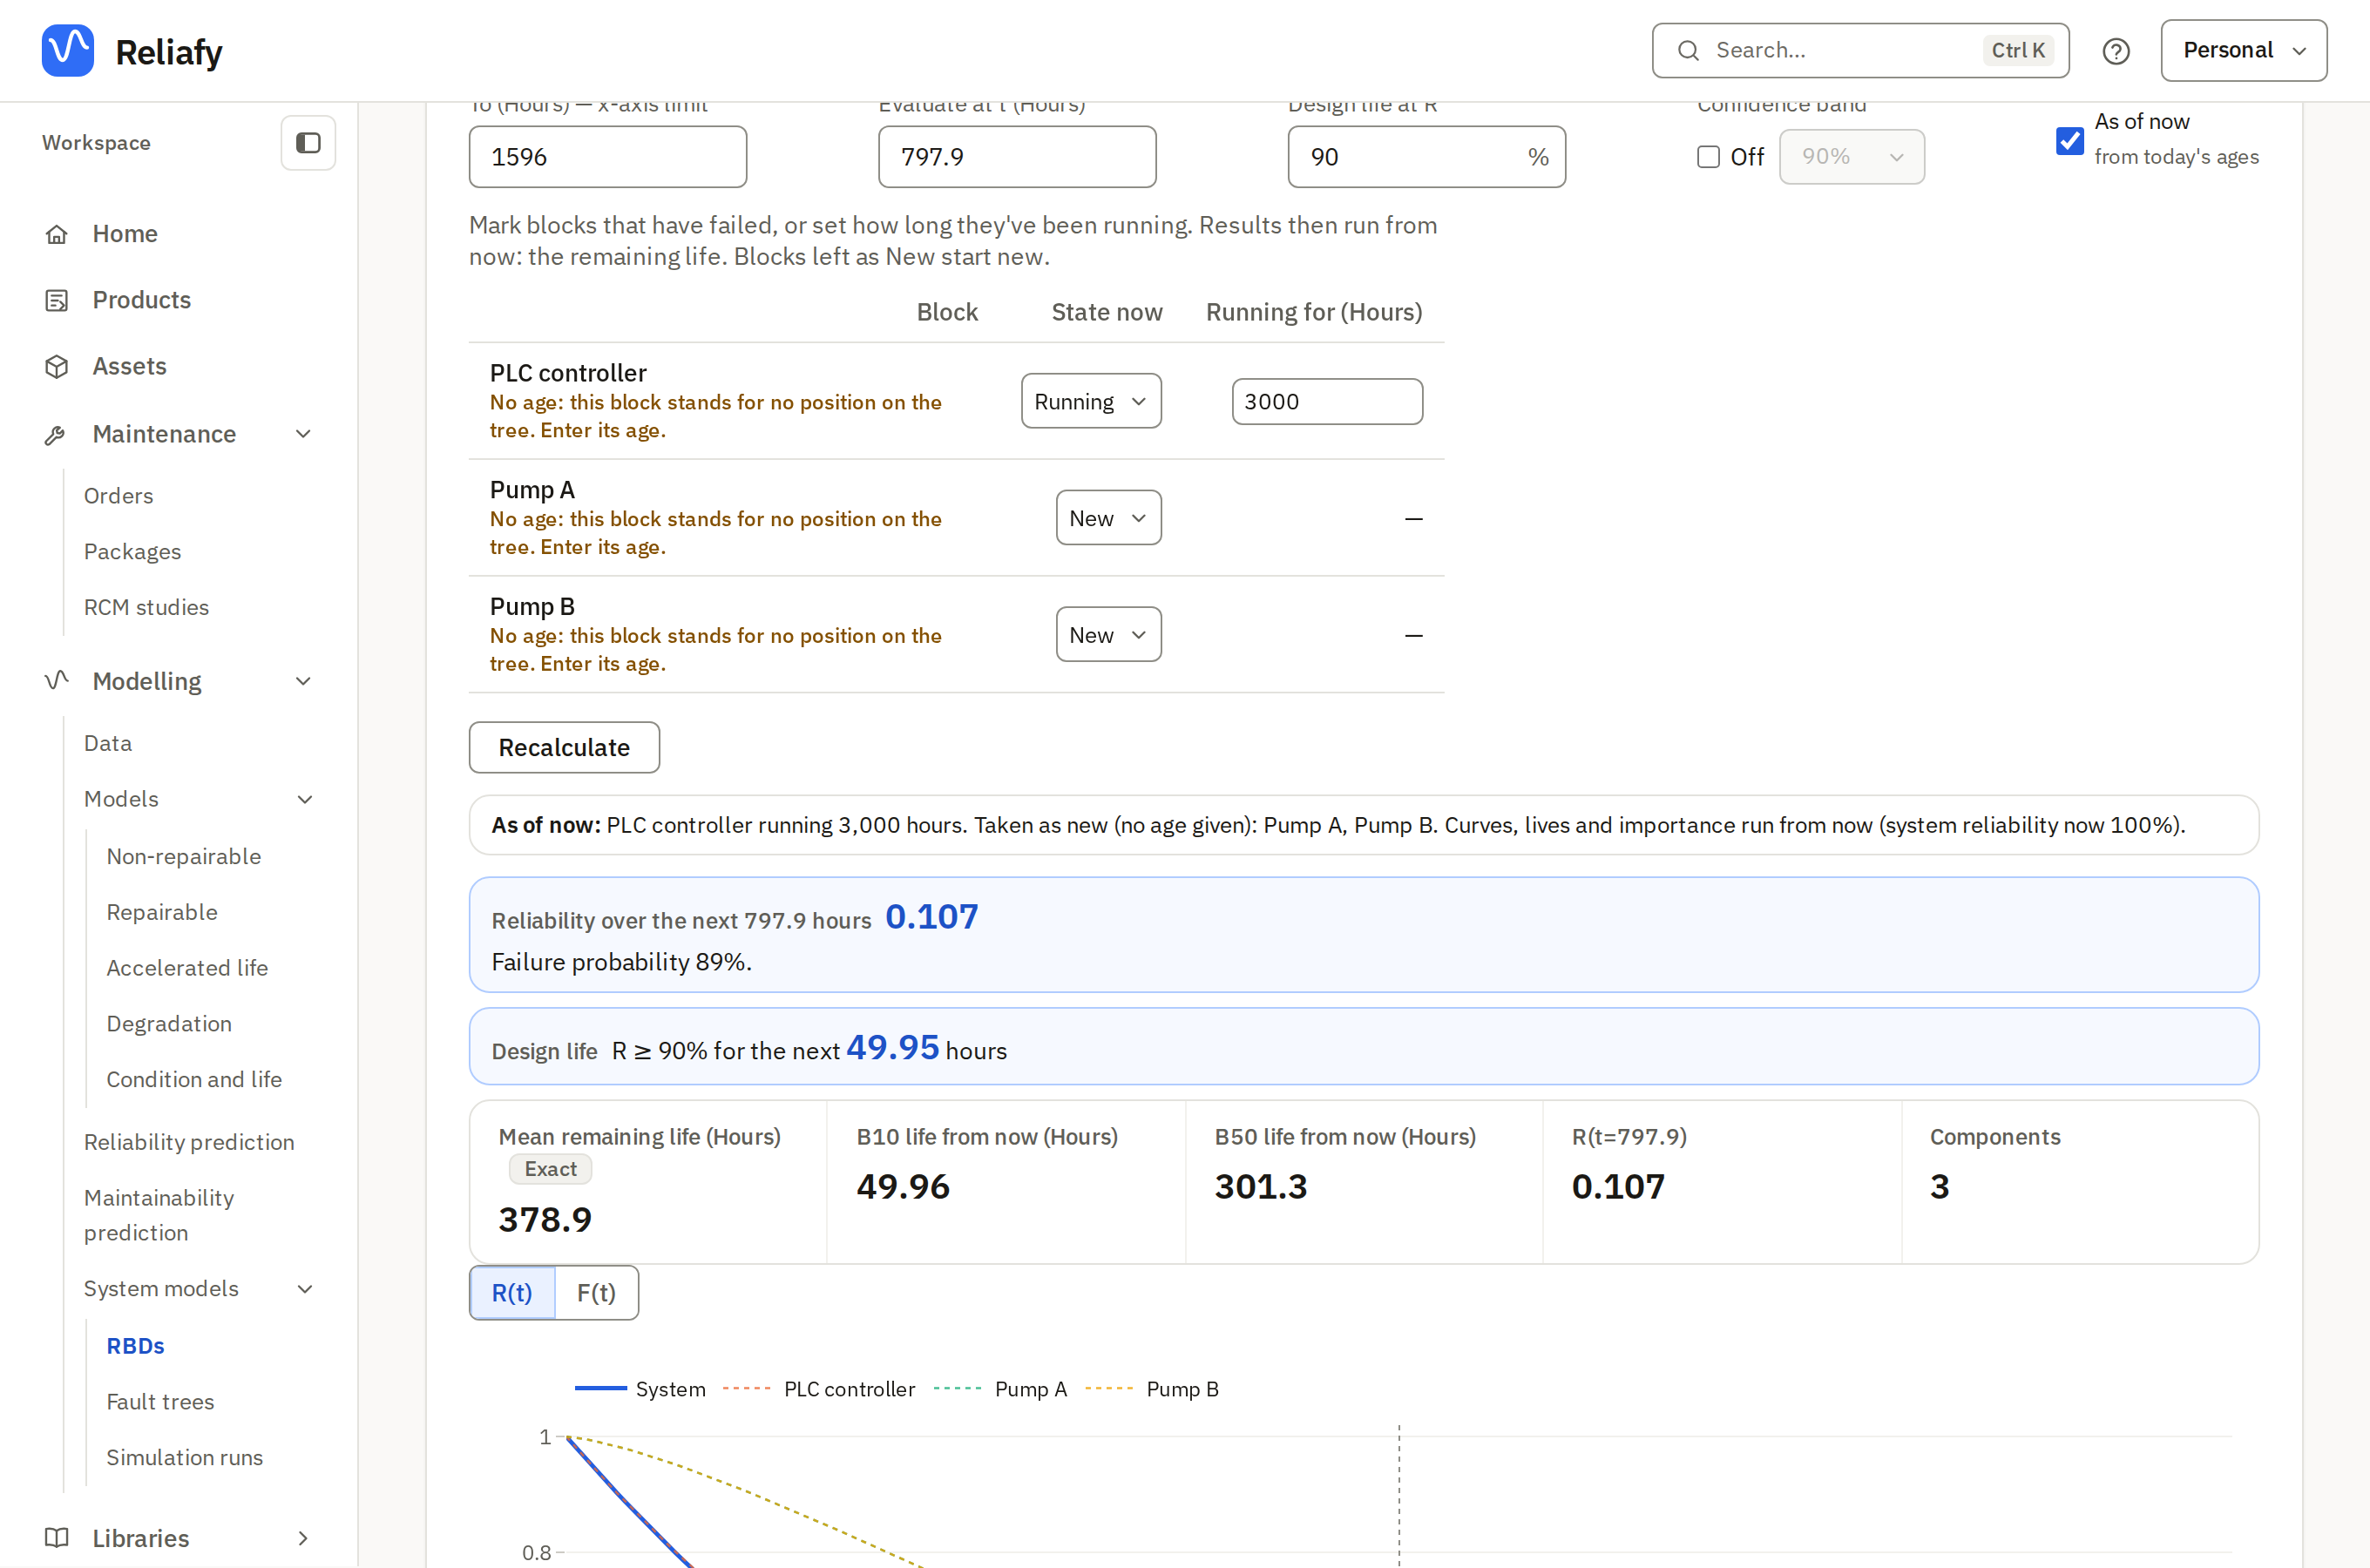
On the diagram's Calculator, tick As of now (from today's ages) beside Calculate. A table lists the blocks, each with a State now:
- New: starts at age zero. This is how every block begins.
- Running: it has run for a time. Type its age in the diagram's unit, such as 3,000 hours.
- Failed (Down on a repairable diagram, with how long it has been in repair): it has failed, and the system is worked out without it.
Press Calculate. The curves, the MTTF, the B-lives and the importance ranking all run from now. Under the buttons the result says what it assumed: As of now: PLC controller running 3,000 hours. Taken as new (no age given): Pump A, Pump B. Curves, lives and importance run from now.
Where each block's age comes from
You type it, or Reliafy reads it. On a diagram built from your asset tree, each block's age is read from the item fitted at the position the block stands for, and the table says where it came from, under the block's name:
- from its counter: the item's hour meter (or its own counter), at its latest reading;
- from its counter and operating plan: the meter's reading, carried forward to today through the days it was expected to run since it was read;
- from its duty (no counter): the time since it was fitted, at the hours a day the position runs;
- the time since it was fitted: for a diagram counted in days, weeks, months or years;
- running all the time since it was fitted (no counter or duty): check it: the position has neither a counter nor a duty, so Reliafy took it as running around the clock. That is the longest the age can be, so look at it and correct it if you know better.
An age you type is never overwritten by a read one. A diagram you drew by hand has no tree to read: type each age.
Blocks with no age
A block that has no age says why, in amber, and is never quietly taken as new:
- No age: nothing is fitted at Pump A. The position is empty, or its item was removed.
- No age: this block stands for no position on the tree. Enter its age. You added the block by hand and it isn't tied to a position.
- No age: the diagram has no time unit, so an age can't be put in it. Give the diagram a unit.
Leave such a block as New only if it really is new. The result then names every block it took as new (Taken as new (no age given): Controller). If you left every block as New, the result says plainly that these are the figures for new equipment, not an answer from today's ages.
Compare with new equipment
The difference between today and new is the point, so get both:
- Calculate with As of now ticked and note the system's reliability over the next 1,000 hours.
- Untick it (or set every block to New) and calculate again.
For a controller on a 20,000-hour MTBF feeding two Weibull pumps (a 4,000-hour scale and a shape of 2) where either pump can carry the load, the station is about 94.8% likely to get through 1,000 hours from new. With one pump at 3,000 hours and the other new, it is about 93.1%. If the old pump fails today, it is about 89.4% (the controller and the new pump, with no spare). The three together are the case you take to a manager: the figure as it stands, the figure if the old pump fails, and the figure with it replaced.
To see which block limits the system as it stands, read the importance ranking, which runs from now too. It can name a different block from the design ranking, because the old one has less life left.
Repairable systems
A repairable diagram takes the same ticks. A block that is Down says how long it has been in repair, and a block that is Running says how long it has run since new or its last renewal. The Window from now sets how far ahead to look. See repairable availability.
Where to go next
Build a reliability block diagram covers the rest of the calculator, and rank what to fix first with the targets and design tools. To run a mission with the same states, see phased missions: when you set the blocks' ages with As of now, the mission starts from them.